Logistic Growth in Population Dynamics

Lecture 4: Logistic growth equation
•
Comments on problem set
•
Sigmoidal growth curve
•
“Logistic Model” equation
•
Population dynamics
•
Management applications
Logistic growth: growth with limits
•
Because growth is typically
slowed relative to exponential
by density-dependent factors,
the logistic model better
mimics most pop’n growth
•
Calculate population change
with logistic growth using:
dN/dt = rN
t
(1-(N/K))
•
K: the carrying capacity
of the
local environment
Growth is diminished
due to competition,
which is more
apparent as N
approaches K
In lab, Paramecium show logistic growth
logistic growth equation
•
Q2. For r = 0.667, N =
300, K = 400. By how
much will the
population change in a
time step (= what is the
population-level growth
rate)?
Q1. Let’s try using the logistic growth
equation
For r = .667, N = 300,
K = 400. By how much
will the population
change in a time step
(= what is the population-
level growth rate)?
dN/dt = 0.667 * 300 * (1-(300/400))
= 200*(1-(3/4))
= 200 * ¼
= 50 = dN/dt
So, the population is expected
to grow by 50 individuals in
the next time step when
population size is 300 (so will
be 350).
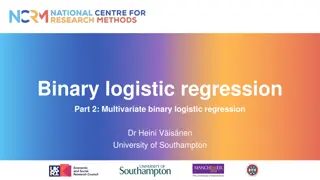
Q3.
How does population
growth change across population
size?
At what point will you have greatest
population-level growth? Why?
Calculate & plot values for r = 0.2, K = 100,000 and: N = 10,
N = 100, N = K/2, N = 75,000, N = K, N = 150,000.
Why is the population growth low at low N? Why is low (or
negative) at high N?
Q2.
How population
growth changes across N?
At what point will you have greatest
population-level growth? Why?
r = 0.2,
K = 100,000;
N = 10, 100,
K/2, 75,000,
K, 150,000
Why is the population growth low at low N? Why is low (or
negative) at high N?
K/2
K
3K/2
U
sually growth of natural populations is
messier than model curves (though usually
still generally fits w/ logistic model)
Populations fluctuate
•
Overshoot & Die offs (predicted
by the logistic model)
•
Variation around K due to Temp
Fig 10.4, Cain et al. 2011, Ecology, Sinauer
K
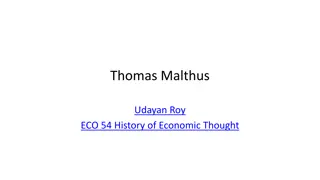
is assumed to be constant but b
irth
and death rates vary over time.
High population size may exhaust resources.
Q3.
Where do you think K was for reindeer on St. Paul
Island? Why?
Birth and death rates vary as abiotic conditions change,
so carrying capacity fluctuates. What does this mean to
model predictions? To management?
From Cain et al. 2011
Ecology Fig 10.5
Sinauer
or if cyclic variation in K:
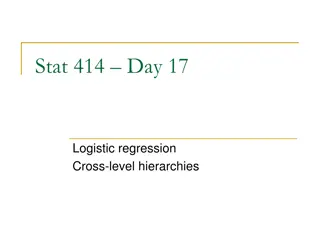
Population fluctuations can also be
caused by predator–prey dynamics.
E.g., Lynx and Hares
E.g. Wolves & Moose
Life History
•
Remember, b-d = intrinsic growth rates (r).
•
Therefore need to understand generally life
strategies regarding birth and death.
•
These are developed over evolutionary time
scales.
Life History
Type 3
Type 1
Management options for populations varies based on their
life histories (reproductive & longevity strategies).
Survivorship curves
are plots of the number of individuals
from a hypothetical cohort that will survive to reach
different ages.
Crouse et al. 1987 and Crowder et al. 1994 estimated how
population growth for loggerhead sea turtles might change
given various management practices.
Early conservation efforts focused on egg and hatchling stages.
However, there’s high mortality for early stages (eggs, nestlings, 1-yr
olds).
Q4. Type survivorship curve? What does this mean for
management?
Even if hatchling
survival were
increased to
100%, loggerhead
populations would
continue to
decline.
Population growth rate was
most responsive to
decreasing mortality of
older juveniles and adults.
Prompted laws to add
turtle-escape hatches to
shrimp nets. These
decreased net-caused
mortality 44%.
Management Applications
Tragedy of the Commons
Garrett Hardin’s classic theory of depletion of common pool
resources: the tendency of a shared, limited resource to
become depleted because people act from self interest
•
Common grazing area
•
What’s best for each farmer in the short term? long term?
Tragedy of the Commons
Tragedy of the commons is explained best using game theory
•
One player compromises – one has high yield, other low yield
•
Both players compromise – everyone has moderate yield
•
Neither compromise – high yield, then resource crash to v. low yield
•
What’s best for each farmer in long term?
•
What might keep them honest?
Overfishing and the collapse of the
Northern Cod (Atlantic Cod)
•
Cod collapse often used as an example of MSY gone
wrong, but also bad management of common pool
resources (CPR)
Maximum Sustainable Yield (MSY)
•
Maximum sustainable yield
: greatest harvest
of a renewable resource that does not
compromise the future availability of that
resource. (pp 264-5)
•
Why is this concept useful?
•
How do you determine the level at which to
harvest?
Maximum Sustainable Yield (MSY)
•
Assumption: population
growth is fastest at K/2
•
Theory: Use the logistic
growth curve as the
basis for a harvesting
plan. To keep the
population sustainable,
try to maintain it at K/2.
Maximum Sustainable Yield
•
H = rate of harvest
•
The system is at equilibrium when the number of individuals
removed is same as growth rate.
•
For almost all harvest rates, there can be two pop sizes
yielding the same growth rates, far from vs. close to carrying
capacity
Maximum Sustainable Yield
Problems
•
Predicting the carrying capacity and the
maximum growth rate in natural populations
is difficult. These vary across time due to
natural fluctuations.
•
If calculated wrong, harvest often happens at
the H3 level (see previous slide) rather than
the H2 level.
•
Harvest usually occurs at all size and age
ranges – but each of these can drastically
affect current and future populations
Q5. Maximum sustainable yield
revisited
•
What should you do to manage for
fluctuation?
•
What does fluctuation mean for your estimate
of Maximum sustainable yield?
Explore the logistic growth equation and its applications in modeling population dynamics. Dive into the concept of sigmoidal growth curves and the logistic model, which reflects population growth with limits. Learn how to calculate population change using the logistic growth equation and understand how growth rate diminishes as population size nears the carrying capacity. Discover real-world examples like Paramecium demonstrating logistic growth. Solve scenarios and analyze how population growth changes across different population sizes, identifying points of greatest growth and understanding why growth rates vary.

Download Presentation

Please find below an Image/Link to download the presentation.
The content on the website is provided AS IS for your information and personal use only. It may not be sold, licensed, or shared on other websites without obtaining consent from the author.If you encounter any issues during the download, it is possible that the publisher has removed the file from their server.
You are allowed to download the files provided on this website for personal or commercial use, subject to the condition that they are used lawfully. All files are the property of their respective owners.
The content on the website is provided AS IS for your information and personal use only. It may not be sold, licensed, or shared on other websites without obtaining consent from the author.
E N D
Presentation Transcript
Lecture 4: Logistic growth equation Comments on problem set Sigmoidal growth curve Logistic Model equation Population dynamics Management applications
Logistic growth: growth with limits Because growth is typically slowed relative to exponential by density-dependent factors, the logistic model better mimics most pop n growth Calculate population change with logistic growth using: dN/dt = rNt(1-(N/K)) K: the carrying capacity of the local environment Growth is diminished due to competition, which is more apparent as N approaches K
logistic growth equation Q2. For r = 0.667, N = 300, K = 400. By how much will the population change in a time step (= what is the population-level growth rate)? = rN dt dN N * 1 K
Q1. Lets try using the logistic growth equation dN/dt = 0.667 * 300 * (1-(300/400)) = 200*(1-(3/4)) = 200 * = 50 = dN/dt So, the population is expected to grow by 50 individuals in the next time step when population size is 300 (so will be 350). For r = .667, N = 300, K = 400. By how much will the population change in a time step (= what is the population- level growth rate)? 1 dN N = * rN dt K
Q3. How does population growth change across population size? At what point will you have greatest population-level growth? Why? dN dt =rN 1-N K Calculate & plot values for r = 0.2, K = 100,000 and: N = 10, N = 100, N = K/2, N = 75,000, N = K, N = 150,000. Population- level growth rate, dN/dt 0 K/2 K 3K/2 Population size, N Why is the population growth low at low N? Why is low (or negative) at high N?
Q2. How population growth changes across N? At what point will you have greatest population-level growth? Why? dN dt =rN 1-N K r = 0.2, K = 100,000; N = 10, 100, K/2, 75,000, K, 150,000 N dN/dt 10 2 K/2 K 3K/2 100 20 50000 75000 100000 150000 -15000 5000 3750 0 Why is the population growth low at low N? Why is low (or negative) at high N?
Usually growth of natural populations is messier than model curves (though usually still generally fits w/ logistic model) Populations fluctuate Overshoot & Die offs (predicted by the logistic model) Variation around K due to Temp Fig 10.4, Cain et al. 2011, Ecology, Sinauer
K is assumed to be constant but birth and death rates vary over time. High population size may exhaust resources. Q3. Where do you think K was for reindeer on St. Paul Island? Why? 2500 2000 Herd size 1500 1000 500 0 1910 1915 1920 1925 1930 1935 1940 1945 1950 1955 Year Fig 1. Number of reindeer (herd size) on St. Paul Island, Alaska over time (year) from 1911-1941 after introduction of 25 reindeer. Data from Scheffer 1951, with estimates for 1942-45.
Birth and death rates vary as abiotic conditions change, so carrying capacity fluctuates. What does this mean to model predictions? To management? From Cain et al. 2011 Ecology Fig 10.5 Sinauer 2 ? = ? ?? 2 or if cyclic variation in K: ?? = ? + amplitude of cycle* [cos(2 t/cycle length)]
Population fluctuations can also be caused by predator prey dynamics. E.g., Lynx and Hares
Life History Remember, b-d = intrinsic growth rates (r). Therefore need to understand generally life strategies regarding birth and death. These are developed over evolutionary time scales.
Life History Type 3 Type 1
Management options for populations varies based on their life histories (reproductive & longevity strategies). Survivorship curves are plots of the number of individuals from a hypothetical cohort that will survive to reach different ages.
Crouse et al. 1987 and Crowder et al. 1994 estimated how population growth for loggerhead sea turtles might change given various management practices. Early conservation efforts focused on egg and hatchling stages. However, there s high mortality for early stages (eggs, nestlings, 1-yr olds). Q4. Type survivorship curve? What does this mean for management?
Even if hatchling survival were increased to 100%, loggerhead populations would continue to decline. Population growth rate was most responsive to decreasing mortality of older juveniles and adults. Prompted laws to add turtle-escape hatches to shrimp nets. These decreased net-caused mortality 44%.
Tragedy of the Commons Garrett Hardin s classic theory of depletion of common pool resources: the tendency of a shared, limited resource to become depleted because people act from self interest Common grazing area What s best for each farmer in the short term? long term?
Tragedy of the Commons Tragedy of the commons is explained best using game theory One player compromises one has high yield, other low yield Both players compromise everyone has moderate yield Neither compromise high yield, then resource crash to v. low yield What s best for each farmer in long term? What might keep them honest?
Overfishing and the collapse of the Northern Cod (Atlantic Cod) Cod collapse often used as an example of MSY gone wrong, but also bad management of common pool resources (CPR)
Maximum Sustainable Yield (MSY) Maximum sustainable yield: greatest harvest of a renewable resource that does not compromise the future availability of that resource. (pp 264-5) Why is this concept useful? How do you determine the level at which to harvest?
Maximum Sustainable Yield (MSY) Assumption: population growth is fastest at K/2 Theory: Use the logistic growth curve as the basis for a harvesting plan. To keep the population sustainable, try to maintain it at K/2.
Maximum Sustainable Yield H = rate of harvest The system is at equilibrium when the number of individuals removed is same as growth rate. For almost all harvest rates, there can be two pop sizes yielding the same growth rates, far from vs. close to carrying capacity
Maximum Sustainable Yield Problems Predicting the carrying capacity and the maximum growth rate in natural populations is difficult. These vary across time due to natural fluctuations. If calculated wrong, harvest often happens at the H3 level (see previous slide) rather than the H2 level. Harvest usually occurs at all size and age ranges but each of these can drastically affect current and future populations
Q5. Maximum sustainable yield revisited What should you do to manage for fluctuation? What does fluctuation mean for your estimate of Maximum sustainable yield?


")
")