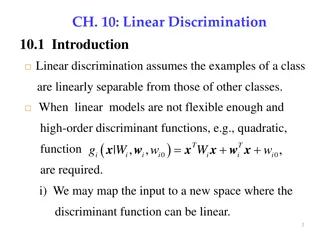
OSeMOSYS: Energy System Modelling and Linear Programming
Energy systems modelling with OSeMOSYS involves linear programming to determine the optimal energy system configuration. The tool considers factors like demand, available technologies, emissions, and constraints to minimize costs over decades. Linear programming, developed during World War II, plays a crucial role in various industries today, including energy system planning.

Download Presentation

Please find below an Image/Link to download the presentation.
The content on the website is provided AS IS for your information and personal use only. It may not be sold, licensed, or shared on other websites without obtaining consent from the author.If you encounter any issues during the download, it is possible that the publisher has removed the file from their server.
You are allowed to download the files provided on this website for personal or commercial use, subject to the condition that they are used lawfully. All files are the property of their respective owners.
The content on the website is provided AS IS for your information and personal use only. It may not be sold, licensed, or shared on other websites without obtaining consent from the author.
E N D
Presentation Transcript
OSeMOSYS 1
Outline 1. Energy and electricity systems modelling 2. Electricity systems modelling 3. Introduction to electricity modelling in OSeMOSYS 2
3. Introduction to electricity modelling in OSeMOSYS Objective: Understand linear programing electricity modelling in OSeMOSYS 3
Models in electricity systems planning and analysis Stability analysis Load flow analysis Electricity market analysis Long-term electricity system analysis 4
Open Source energy MOdelling SYStem (OSeMOSYS) www.osemosys.org M. Howells et al. (2011), OSeMOSYS: The Open Source Energy Modeling System: An introduction to its ethos, structure and development. Energy Policy. Model generator converting the energy system structure represented by equations into a matrix to be solved by specific solvers Open source Deterministic Dynamic Perfect foresight Paradigm comparable to MESSAGE or TIMES Linear optimization 5
What does OSeMOSYS do? It determines the energy system configuration with the minimum total discounted cost for a time domain of decades, constrained by: Demand for energy (e.g., electricity, heating, cooling, km-passengers, etc.) that needs to be met Available technologies and their techno-economic characteristics (levelized cost of electricity, efficiency, lifetime, etc.) Emissions taxation, generation targets (e.g., renewables) Other constraints (e.g., ramping capability, availability of resources, investment decisions, etc.) 6
What is linear programming ? A special case of mathematical programming that can be represented by linear relationships Devoped by Leonid Kantorovich in 1939 for use during World War II to plan expenditures and returns minimize costs to the army and maximize losses to the enemy Kept secret till 1947 Now used in energy system planning, banking, education, forestry, petroleum, and logistics Survey of Fortune 500 firms: 85 per cent said they had used linear programming1 Linear programing consists of: A linear objective function subject to linear equalities and/or linear inequalities 1 From W. L. Winston (2004), Operations Research: Applications and Algorithms. 4th Edition. Thomson. 7
Linear programming a simple example Optimal allocation of oil and gas for electricity generation Oil Policy and operational constraints determine solution space Objective function: system cost minimization minimize z = cx Subject to: Ax = b, x 0 Maximum oil import Oil use for transport Natural gas 8
OSeMOSYS input parameters Existing historical capacity Fuel costs Capital costs Operations/maintenance costs Efficiency Ramping characteristics Emission factors Production targets Investment constraints Taxation on emissions Availability of resources Etc.... 9
Input parameters Electricity demand projections Primary resources potentials Existing capacity Technology costs and characteristics Country/region specific constraints Fuel prices Data collection Data pre-processing Adapting demand curves to model Assume data if not available Validate data with governments Define the starting year for the modelling (a past year with sound actual data) Tweak inputs such that modelling outputs resemble actual performance Model calibration 10
Interpreting modelling results The results answer questions such as: Which technologies are phasing out? By when? What are the optimal investments in new technologies to meet the demand in the future? When is it best to invest? What are the key generation technologies in the total energy mix? Which capacities are NOT being utilized? Why? What costs will the energy system incur? 11
Interpreting modelling results What would be the impact of large swings in oil prices? Can we fully rely on renewables? If not, what is the maximum share of renewables that the energy system can accommodate? Can it be financed? Should the tax on transport fuels increase to encourage the use of public transportation? Would switching to "advanced technologies" allow us to continue improving living standards and simultaneously avoid climate change? Can we really afford heavy upfront investment technologies? For example, wind, CSP, PV, hydro, etc.? What is the impact of energy efficiency measures on the supply mix? 12
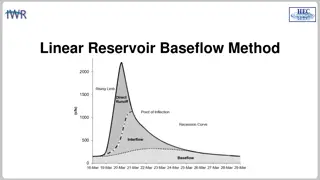
Representative OSeMOSYS results Hydro and CCGT most competitive Electricity generation (PJ) Initial capacity of COAL PP phased out at end of life Year 13
Representative OSeMOSYS results What happens in a climate change adaptation scenario? Electricity generation (PJ) More generation from COAL PP, less reliance on HYDRO Year 14
THANK YOU OSeMOSYS www.osemosys.org 15