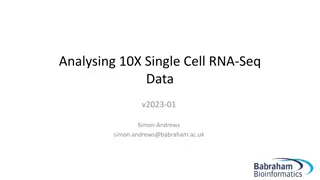
Investigating Small RNA Bias in RNA-Seq Libraries


Probing Sequence-specific effects
RNA-Seq
and RNA Synthesis

Alton Etheridge, Nikita A. Sakhanenko, David J. Galas
Pacific Northwest Research Institute
Seattle, WA
April 2014


Focus on small RNAs
•
Our focus is on small RNAs because
–
This is a major area of interest for us and
the NIH exRNA consortium
–
There are significant issues with small RNA-
seq
•
Longer RNA present a different set of
problems
Sources of bias in RNA-seq Experiments
Sample Acquisition
and Handling
RNA isolation and
purification
Seq. Library
preparation
Sequence data
acquisition
Data analysis
Our focus is here
The RNA-seq Bias problem
•
Recent studies have identified RNA-seq library
construction biases as a significant problem.
•
Up to 100-fold differences in miRNA read levels between
different protocols have been reported
•
Systematically study the library construction bias issue
•
Goals
–
Characterize the biases in detail
–
Understand the source of biases, and
–
Try to find a correction method
•
This is an important issue for the reference profiles
References: Bias in RNA-seq Libraries
1)
Hafner M, Renwick N, Brown M, Mihailovic A, Holoch D, Lin C, Pena JT, Nusbaum JD,
Morozov P, Ludwig J et al.
2011
. RNA-ligase-dependent biases in miRNA representation
in deep-sequenced small RNA cDNA libraries.
RNA
17
: 1697-1712.
2)
Huang X, Yuan T, Tschannen M, Sun Z, Jacob H, Du M, Liang M, Dittmar RL, Liu Y, Liang
M et al.
2013
. Characterization of human plasma-derived exosomal RNAs by deep
sequencing.
BMC genomics
14
: 319.
3)
Jayaprakash AD, Jabado O, Brown BD, Sachidanandam R.
2011
. Identification and
remediation of biases in the activity of RNA ligases in small-RNA deep sequencing.
Nucleic acids research
39
: e141.
4)
Leshkowitz D, Horn-Saban S, Parmet Y, Feldmesser E.
2013
. Differences in microRNA
detection levels are technology and sequence dependent.
RNA
19
: 527-538.
5)
Raabe CA, Tang TH, Brosius J, Rozhdestvensky TS.
2014
. Biases in small RNA deep
sequencing data.
Nucleic acids research
42
: 1414-1426.
6)
Sorefan K, Pais H, Hall AE, Kozomara A, Griffiths-Jones S, Moulton V, Dalmay T.
2012
.
Reducing ligation bias of small RNAs in libraries for next generation sequencing.
Silence
3
: 4.
7)
Zhang Z, Lee JE, Riemondy K, Anderson EM, Yi R.
2013
. High-efficiency RNA cloning
enables accurate quantification of miRNA expression by deep sequencing.
Genome
biology
14
: R109.
8)
Zhuang F, Fuchs RT, Sun Z, Zheng Y, Robb GB.
2012
. Structural bias in T4 RNA ligase-
mediated 3'-adapter ligation.
Nucleic acids research
40
: e54.
Original hypotheses
•
The ligation step seems to be the critical one for small
RNA
bias (based on several studies including Tuschl’s)
•
If the sequence specificity is based on the ligation bias,
the end sequences of the RNA should be most
important in determining bias.
•
Characterizing the bias for specific end sequences
might provide a correction factor for each protocol
•
We need a systematic study of sequence specificity to
determine if this is possible
•
Now we know that using the ends is insufficient and
won’t work as a correction method as we expected
•
Systematic Approach to Bias
Ribo-oligonucleotide Libraries with degenerate bases
•
A range of synthetic RNA populations with fixed and degenerate bases have
been made and sequenced. These include:
–
Synthetic 23 mers with random bases on each end and a fixed core sequence
(with several different cores)
–
Synthetic RNAs with internal degenerate bases
•
We examined several RNA-seq library protocols
–
Included Illumina True-seq, NEB, BioO and a home-brewed protocol
•
In the course of this work we discovered:
–
How to assess the
synthesis bias
and
–
How to separate out the
sequence-specific library bias
–
Some information and hypotheses about the nature of sequence-specific library
bias
Ligate on Adapters
Analyze data and assess bias for each oligonucleotide
Reads
RT, amplify and Sequence
Scheme for Small RNA Library Bias Assessment
Synthesize random-end RNA oligo library
4-mer 15-bases 4-mer
Lib. protocols
TS 15
TS 8
NEB 15
NEB 8
Wide range of read numbers over the ~65,000 Oligonucleotides
L1 core, Protocols: TS 15, TS 8, NEB 15, NEB 8 (all fixed end, different PCR cycle numbers)
TS = Illumina True seq protocol
NEB = New England Biolab protocol
Number = number of PCR cycles
Number of Reads
Oligo Number ordered by Number of Reads
What part of this is sequence bias?
Distribution of read numbers for each end (TS protocol)
(
approximately log normal
)
Number of oligos with read numbers in interval
5’ 3’
Fixed sequences have no synthesis bias (288 synthetic miRNAs)
Base content of miRNAs (fractions) vs fraction of reads
25%
Distribution of reads for 288
equimolar
miRs (red)
is also roughly log normal (blue)
H protocol
Examples of the RNA populations
synthesized
Some Libraries with
D
egenerate
B
ases
Base content observed in the degenerate bases
Read fraction median as a function of number of G’s,
n
:
f
(
n
)
≅
0.0003 e
0.757
n
(L5)
: H
H protocol: 4N
adaptors
TTG
N
ATG
N
CTG
N
CGT
N
CGT
N
ACG
Synthesis bias
•
In principle variations could be due to any
combination of
Synthesis
and
Sequencing
bias
•
Can we distinguish synthesis bias in our
experimental libraries?
1.
If context were not important in synthesis bias, and
sequence-specific bias is mostly context, the fractional
composition profile of random reads can be predicted
from insertion bias
2.
These hypotheses can be directly tested
3.
For
n
degen. bases there are
n
+1 quantities predicted by a
single parameter, so a total of 4(
n
+1) measured quantities
and 4 parameters
4.
In addition there are 4 other measured quantities the base
content of the degenerate bases
Read fraction median as a function of number of G’s,
n
:
f
(
n
)
≅
0.0003 e
0.757
n
(L5)
: H
AE protocol:
4N adaptors
Internal “RANDOM” bases
TTG
N
ATG
N
CTG
N
CGT
N
CGT
N
ACG
C has the opposite effect of G, but
A & T have almost no effect
Read fraction median as a function of number of G’s,
n
:
f
(
n
)
≅
0.00027 e
0.65
n
(L6)
AE protocol:
4N adaptors
Clustered internal “RANDOM
” bases
TTGAATGGC
NNNNN
TACGTGACG
C has the opposite effect of G, but
A & T have almost no effect
For fixed sequence synthetic oligos (288)
Additional evidence:
1.
No composition bias is seen
for fixed sequence synthetic
miR’s
2.
There are different
parameters for different
syntheses – difference are
greater than SD measured
Logic of Sorting out Synthesis Bias
p
(Probability of G insertion)
Fraction of Sequences Expected ( 5 bases)
n=0
n=1
n=2
n=3
n=4
n=5
Probability of G composition in Synthesis
5 degenerate bases 6 measured quantities
Measured quantities
•
For L5 there are 6 quantities measured for G (or any
other base) composition.
•
If we assume the independent insertion frequency model
there is then one parameter to fit these 6 quantities
•
All
these equations must be satisfied simultaneously
•
This is a highly constrained system [
f
(G=n) is the fraction
of all oligos with n G’s in the degenerate bases]
f
(G=0)=(1-
p
)
5
f
(G=1)=5
p
(1-
p
)
4
f
(G=2)=10
p
2
(1-
p
)
3
f
(G=3)=10
p
3
(1-
p
)
2
f
(G=4)=5
p
4
(1-
p
)
f
(G=5)=
p
5
In addition, the measured
quantity, which is the fractional
base content of the degenerate
bases,
f
(G) should be equal to
p
L5: Comparison with Data: G
TTG
N
ATG
N
CTG
N
CGT
N
CGT
N
ACG
p
(Probability of G insertion)
Probability of G Composition in 5 bases
n=0
n=1
n=2
n=3
n=4
n=5
Data is explained by an insertion rate of G’s of
~ 0.42,
and
f
(G), the fraction of degenerate bases that are G, = ~0.42
L5: Comparison with Data: C
p
(Probability of C insertion)
Probability of G Composition in 5 bases
n=0
n=1
n=2
n=3
n=4
n=5
Data is explained by an insertion rate of C’s of
0.15,
and
f
(G)=0.15
Comparison with Data: T
p (Probability of T insertion)
Probability of G Composition in 5 bases
n=0
n=1
n=2
n=3
n=4
n=5
Data is explained by an insertion rate of C’s of
0.236
L6: Comparison with Data: G
TTGAATGGC
GGTAG
TACGTGACG
p (Probability of G insertion)
Probability of G Composition in 5 bases
n=0
n=1
n=2
n=3
n=4
n=5
Data is explained by an insertion rate of G’s of ~
0.40
(0.39 to 0.43),
and
f
(G)
=
0.4
Fractions of Reads for Identical Composition 2210: L5-H
[Composition code: 2210 = 2G’s, 2C’s, 1 A and no T’s]
L5-H: Fraction of reads for oligos with specific number of G’s
divided by the number such oligos
(independent of position)
f
(G=n)=B(5,n)
p
n
(1-
p
)
5-n
B(5,n) = binomial coefficient
G Composition measured
Read Fractions of L5 oligos corrected for composition synthesis
Ordered by corrected fractions (red), uncorrected in blue
Conclusion: Synthesis bias
•
The fraction of reads of all oligos with specific
numbers of bases fits a single parameter model
•
A single insertion probability, largely independent
of position, explains all fractions
•
Either:
–
The specific insertion of each of the bases in synthesis
is responsible, or
–
the sequence-specific bias is affected by bases
numbers in a fashion independent of position in the
oligo (degenerate bases) – unlikely!
NNNN
-------L1---------
NNNN
Data from L1-H Library: 8 degenerate bases
(sum of read fractions vs G content: 9measured quantities)
p
(Probability of G insertion)
Fraction of Sequences Expected ( 8 bases)
n=0
n=1
n=2
n=3
n=4
n=5
Probability of G composition in Synthesis
n=6
n=7
n=8
Multiple Fractions G content data: 3’ 8N—L1 (H protocol)
Single parameter fit G data (blue dots), independent insertion model
Equal probabilities
G insertion,
p
= 0.32
(best fit)
Data
Number of G’s
0 G’s
1 G
2 G’s
3 G’s
4 G’s
2 G’s
2 G’s, 3 C’s
0 G’s 1 G 2 G 3 G
C
0 1 2 3 4
C
0 1 2 3 4
C
0 1 2 3 4
C
0 1 2 3 4
•
We can quantitatively characterize large synthetic RNA-
populations to a high degree
•
single base synthesis insertion frequencies account for the levels of
composition seen in RNA-seq.
o
Large synthetic RNA populations are powerful tools for
dissecting sequence-specific bias. In short,
o
Sequence-specific variation levels are protocol-specific
o
Sequence-specific effects are order-specific
o
They range from <10 fold to >100 fold
•
New computational approaches probing sequence features
that are the sources of bias detect some patterns.
•
A work in progress!
Summary
37
Small RNA bias in RNA-Seq libraries is a significant issue affecting data analysis. Understanding biases in library construction is crucial for accurate profiling of small RNAs.

Download Presentation

Please find below an Image/Link to download the presentation.
The content on the website is provided AS IS for your information and personal use only. It may not be sold, licensed, or shared on other websites without obtaining consent from the author.If you encounter any issues during the download, it is possible that the publisher has removed the file from their server.
You are allowed to download the files provided on this website for personal or commercial use, subject to the condition that they are used lawfully. All files are the property of their respective owners.
The content on the website is provided AS IS for your information and personal use only. It may not be sold, licensed, or shared on other websites without obtaining consent from the author.
E N D
Presentation Transcript
Probing Sequence-specific effects RNA-Seq and RNA Synthesis Alton Etheridge, Nikita A. Sakhanenko, David J. Galas Pacific Northwest Research Institute Seattle, WA April 2014
Focus on small RNAs Our focus is on small RNAs because This is a major area of interest for us and the NIH exRNA consortium There are significant issues with small RNA- seq Longer RNA present a different set of problems
Sources of bias in RNA-seq Experiments Sample Acquisition and Handling RNA isolation and purification Seq. Library preparation Sequence data acquisition Our focus is here Data analysis
The RNA-seq Bias problem Recent studies have identified RNA-seq library construction biases as a significant problem. Up to 100-fold differences in miRNA read levels between different protocols have been reported Systematically study the library construction bias issue Goals Characterize the biases in detail Understand the source of biases, and Try to find a correction method This is an important issue for the reference profiles
References: Bias in RNA-seq Libraries 1) Hafner M, Renwick N, Brown M, Mihailovic A, Holoch D, Lin C, Pena JT, Nusbaum JD, Morozov P, Ludwig J et al. 2011. RNA-ligase-dependent biases in miRNA representation in deep-sequenced small RNA cDNA libraries. RNA17: 1697-1712. 2) Huang X, Yuan T, Tschannen M, Sun Z, Jacob H, Du M, Liang M, Dittmar RL, Liu Y, Liang M et al. 2013. Characterization of human plasma-derived exosomal RNAs by deep sequencing. BMC genomics14: 319. 3) Jayaprakash AD, Jabado O, Brown BD, Sachidanandam R. 2011. Identification and remediation of biases in the activity of RNA ligases in small-RNA deep sequencing. Nucleic acids research39: e141. 4) Leshkowitz D, Horn-Saban S, Parmet Y, Feldmesser E. 2013. Differences in microRNA detection levels are technology and sequence dependent. RNA19: 527-538. 5) Raabe CA, Tang TH, Brosius J, Rozhdestvensky TS. 2014. Biases in small RNA deep sequencing data. Nucleic acids research42: 1414-1426. 6) Sorefan K, Pais H, Hall AE, Kozomara A, Griffiths-Jones S, Moulton V, Dalmay T. 2012. Reducing ligation bias of small RNAs in libraries for next generation sequencing. Silence 3: 4. 7) Zhang Z, Lee JE, Riemondy K, Anderson EM, Yi R. 2013. High-efficiency RNA cloning enables accurate quantification of miRNA expression by deep sequencing. Genome biology14: R109. 8) Zhuang F, Fuchs RT, Sun Z, Zheng Y, Robb GB. 2012. Structural bias in T4 RNA ligase- mediated 3'-adapter ligation. Nucleic acids research40: e54.
Original hypotheses The ligation step seems to be the critical one for small RNA bias (based on several studies including Tuschl s) If the sequence specificity is based on the ligation bias, the end sequences of the RNA should be most important in determining bias. Characterizing the bias for specific end sequences might provide a correction factor for each protocol We need a systematic study of sequence specificity to determine if this is possible Now we know that using the ends is insufficient and won t work as a correction method as we expected
Systematic Approach to Bias Ribo-oligonucleotide Libraries with degenerate bases A range of synthetic RNA populations with fixed and degenerate bases have been made and sequenced. These include: Synthetic 23 mers with random bases on each end and a fixed core sequence (with several different cores) Synthetic RNAs with internal degenerate bases We examined several RNA-seq library protocols Included Illumina True-seq, NEB, BioO and a home-brewed protocol In the course of this work we discovered: How to assess the synthesis bias and How to separate out the sequence-specific library bias Some information and hypotheses about the nature of sequence-specific library bias
Scheme for Small RNA Library Bias Assessment Synthesize random-end RNA oligo library 4-mer 15-bases 4-mer NNNN Core NNNN Ligate on Adapters Lib. protocols 5 NNNN Core NNNN 3 RT, amplify and Sequence Reads Analyze data and assess bias for each oligonucleotide
Wide range of read numbers over the ~65,000 Oligonucleotides L1 core, Protocols: TS 15, TS 8, NEB 15, NEB 8 (all fixed end, different PCR cycle numbers) What part of this is sequence bias? Number of Reads > 4 orders of magnitude NEB 15 NEB 8 TS 8 TS 15 Oligo Number ordered by Number of Reads TS = Illumina True seq protocol NEB = New England Biolab protocol Number = number of PCR cycles
Distribution of read numbers for each end (TS protocol) (approximately log normal) Number of oligos with read numbers in interval 5 3
Fixed sequences have no synthesis bias (288 synthetic miRNAs) Base content of miRNAs (fractions) vs fraction of reads 25%
Distribution of reads for 288 equimolar miRs (red) is also roughly log normal (blue) 0.14? 0.12? 0.1? 0.08? 0.06? 0.04? 0.02? 0? 0.2?0.4?0.6?0.8? 1? 1.2?1.4?1.6?1.8? 2? 2.2?2.4?2.6?2.8? 3? 3.2?3.4?3.6?3.8? 4? 4.2?4.4?4.6?4.8? 5? 5.2?5.4?5.6?5.8? 6? 6.2?6.4?6.6?6.8? 7? 7.2?7.4?7.6?7.8? 8? H protocol
Examples of the RNA populations synthesized Some Libraries with Degenerate Bases Base content observed in the degenerate bases Library Sequence Library L1 L2 L5 L6 L7 L8 Avg. % A 26 27 20 22 23 23 23.5 % C 15 15 15 16 18 17 16.0 % G 34 33 42 39 37 41 37.7 % T 25 25 23 23 22 19 22.8 NNNNAUGGCUGACGUACGUNNNN NNNNUUCGUGCGAUCUAGGNNNN UUGNAUGNCUGNCGUNCGUNACG UUGAAUGGCNNNNNUACGUGACG NNNNGCUAGCGUUCAGGUCNNNN NNNNCAACCAUCGAGCUAANNNN L1 L2 L5 L6 L7 L8
: H H protocol: 4N adaptors (L5) TTGNATGNCTGNCGTNCGTNACG Read fraction median as a function of number of G s, n: f(n) 0.0003 e 0.757 n
Synthesis bias In principle variations could be due to any combination of Synthesis and Sequencing bias Can we distinguish synthesis bias in our experimental libraries? 1. If context were not important in synthesis bias, and sequence-specific bias is mostly context, the fractional composition profile of random reads can be predicted from insertion bias 2. These hypotheses can be directly tested 3. For n degen. bases there are n+1 quantities predicted by a single parameter, so a total of 4(n+1) measured quantities and 4 parameters 4. In addition there are 4 other measured quantities the base content of the degenerate bases
: H AE protocol: 4N adaptors (L5) Read fraction median as a function of number of G s, n: f(n) 0.0003 e 0.757 n
Internal RANDOM bases TTGNATGNCTGNCGTNCGTNACG C has the opposite effect of G, but A & T have almost no effect
AE protocol: 4N adaptors (L6) Read fraction median as a function of number of G s, n: f(n) 0.00027 e 0.65 n
Clustered internal RANDOM bases TTGAATGGCNNNNNTACGTGACG C has the opposite effect of G, but A & T have almost no effect
Logic of Sorting out Synthesis Bias What is the base composition profile of the sequence reads? These are measured quantities Can we explain the observed profile with a single parameter? YES (assume position independence tight fit to model) Thus, conclude there is no overall context effect in synthesis. What is this parameter? It is equal to the overall base composition of the observed reads (tight fit) Additional evidence: 1. No composition bias is seen for fixed sequence synthetic miR s 2. There are different parameters for different syntheses difference are greater than SD measured If there is no selection of reads from the synthetic population based on composition then base composition of reads equals base composition of input population. This implies that the base composition is equal to the synthetic base insertion frequency our parameter We then infer that: the composition of the synthetic RNA population from the read measurements Conclude: Sequence specificity is caused by the order of bases among the specific composition groups of oligos
Probability of G composition in Synthesis 5 degenerate bases 6 measured quantities equal Fraction of Sequences Expected ( 5 bases) n=5 n=0 n=3 n=2 n=4 n=1 p (Probability of G insertion) pn(1- p)5-n 5 n Probability(n/5)=
Measured quantities For L5 there are 6 quantities measured for G (or any other base) composition. If we assume the independent insertion frequency model there is then one parameter to fit these 6 quantities All these equations must be satisfied simultaneously This is a highly constrained system [f(G=n) is the fraction of all oligos with n G s in the degenerate bases] f(G=0)=(1-p)5 f(G=1)=5p(1-p)4 f(G=2)=10p2(1-p)3 f(G=3)=10p3(1-p)2 f(G=4)=5p4(1-p) f(G=5)=p5 In addition, the measured quantity, which is the fractional base content of the degenerate bases, f(G) should be equal to p
L5: Comparison with Data: G TTGNATGNCTGNCGTNCGTNACG Probability of G Composition in 5 bases n=1 n=2 n=3 n=0 n=4 n=5 p (Probability of G insertion) Data is explained by an insertion rate of G s of ~ 0.42, and f(G), the fraction of degenerate bases that are G, = ~0.42
L5: Comparison with Data: C n=0 Probability of G Composition in 5 bases n=1 n=2 n=3 n=4 n=5 p (Probability of C insertion) Data is explained by an insertion rate of C s of 0.15, and f(G)=0.15
Comparison with Data: T n=0 Probability of G Composition in 5 bases n=1 n=2 n=3 n=4 n=5 p (Probability of T insertion) Data is explained by an insertion rate of C s of 0.236
L6: Comparison with Data: G TTGAATGGCGGTAGTACGTGACG Probability of G Composition in 5 bases n=1 n=2 n=3 n=0 n=4 n=5 p (Probability of G insertion) Data is explained by an insertion rate of G s of ~ 0.40 (0.39 to 0.43), and f(G)=0.4
Fractions of Reads for Identical Composition 2210: L5-H [Composition code: 2210 = 2G s, 2C s, 1 A and no T s]
L5-H: Fraction of reads for oligos with specific number of Gs divided by the number such oligos (independent of position) f(G=n)=B(5,n)pn(1-p)5-n B(5,n) = binomial coefficient G Composition measured
Read Fractions of L5 oligos corrected for composition synthesis Ordered by corrected fractions (red), uncorrected in blue
Conclusion: Synthesis bias The fraction of reads of all oligos with specific numbers of bases fits a single parameter model A single insertion probability, largely independent of position, explains all fractions Either: The specific insertion of each of the bases in synthesis is responsible, or the sequence-specific bias is affected by bases numbers in a fashion independent of position in the oligo (degenerate bases) unlikely!
Data from L1-H Library: 8 degenerate bases (sum of read fractions vs G content: 9measured quantities) NNNN-------L1---------NNNN
Probability of G composition in Synthesis Fraction of Sequences Expected ( 8 bases) equal n=0 n=8 n=7 n=1 n=2 n=6 n=5 n=3 n=4 p (Probability of G insertion) pn(1- p)8-n 8 n Probability(n/8)=
Multiple Fractions G content data: 3 8NL1 (H protocol) Single parameter fit G data (blue dots), independent insertion model Data G insertion, p = 0.32 (best fit) Equal probabilities Number of G s
3 Gs 2 G s 1 G 4 G s 0 G s 2 G s 2 G s, 3 C s 2210: 3-fold range
0 Gs 1 G 2 G 3 G C 0 1 2 3 4 C 0 1 2 3 4 C 0 1 2 3 4 C 0 1 2 3 4
Summary We can quantitatively characterize large synthetic RNA- populations to a high degree single base synthesis insertion frequencies account for the levels of composition seen in RNA-seq. o Large synthetic RNA populations are powerful tools for dissecting sequence-specific bias. In short, o Sequence-specific variation levels are protocol-specific o Sequence-specific effects are order-specific o They range from <10 fold to >100 fold New computational approaches probing sequence features that are the sources of bias detect some patterns. A work in progress! 37


")

")


")