Introduction to RNA-seq
"Explore the benefits and obstacles of RNA-seq technology in cancer genome analysis, clinical trials, and differential gene expression. Learn the reasons for choosing mRNA-seq over microarray technologies, including increased specificity, reduced bias, and enhanced sensitivity. Discover the advantages of RNA-seq in detecting structural variations, expressed SNVs, and gene expression without the need for probe design. Dive into library preparation techniques and understand the importance of experimental design, raw data processing, mapping, and differential expression analysis."

Download Presentation

Please find below an Image/Link to download the presentation.
The content on the website is provided AS IS for your information and personal use only. It may not be sold, licensed, or shared on other websites without obtaining consent from the author.If you encounter any issues during the download, it is possible that the publisher has removed the file from their server.
You are allowed to download the files provided on this website for personal or commercial use, subject to the condition that they are used lawfully. All files are the property of their respective owners.
The content on the website is provided AS IS for your information and personal use only. It may not be sold, licensed, or shared on other websites without obtaining consent from the author.
E N D
Presentation Transcript
Introduction to RNA-seq Joel Parker, Ph.D.
LCCC Biomedical Informatics UNCseq: Cancer genome analysis of 1000+ UNC Hospital patients TCGA: Processed and distributed 8K+ cancer transcriptomes (>1PB) Cancer Survivorship Cohort: Recruit, track, and follow-up 4k+ patients Genome and transcriptome analytics in multiple clinical trials Management and analytics supporting 10+ clinical programs and 20+ faculty labs Contributing authors to 150+ manuscripts
Introduction to RNA-seq Advantages and challenges of RNA-seq Experimental Design Raw data Mapping Quantification Differential Expression
Why mRNAseq? There are at least four compelling reasons for choosing mRNA-seq instead of microarray based technologies Specificity of what is being measured Reduced technical (batch) bias Increased dynamic range and log ratio (FC) estimates More sensitive detection of genes, transcripts, and differential expression Other reasons Detection of expressed SNVs Detection of fusions and other structural variations No transcriptome definition is needed No probes need to be designed or manufactured Cost (will soon be equivalent on a per assay basis with microarray)
Why mRNAseq? Reduced Bias Cell types separate biologically CD19 CD8 CD14 CD4
Why mRNAseq? Reduced Processing Bias Client s miRNAseq samples sequenced on 4 different machines at 2 different sites at different times over several months with no apparent bias in the top principal components GAIIx HS-01 HS-02 HS-IL
Library preparation Others: Stranded, Exome or target enrichment Blood, MT, etc
Sequencing parameters Read Length Trapnell et al., Nature Biotechnology 31,46 53 (2013)
Detection is Dependent on Depth Genes Isoforms Detection in this case is defined as at least 10 fragments per million (FPM) assigned to the gene or isoform in at least 20% of samples. As the number of clusters increases, so does the number of genes (left) or isoforms (right), but not greatly over 10M. However, 50M is 5x10M but only yields about a 15% increase in detection level.
Computational Processing Technical variation (batch effects) from library preparation and sequencing are small, and the sequencing strategy directs the level of repeatability and detection, especially depth The raw results of sequencing require significant computational processing Alignment : Maximizing unambiguous alignments; Alignment of reads that cross exon junctions; Ex: Bowtie, BWA, TopHat Abundance estimation : Gene or transcript; Handling alignments that are ambiguous in the transcriptome; Ex: Sailfish, RSEM, Cufflinks, MISO, IsoEM, IsoInfer, Rseq, . . . Normalization of read counts : Minimizing bias due to variation in number of clusters available; Ex: Total count (RPM), Upper quartile, quantile, density Different algorithmic and computational strategies, especially the transcriptome definition, impact performance much more than SE vs. PE, 50 bp vs. 100 bp.
Alignment TopHat, MapSplice, STAR Trinity, Trans-Abyss
Incorrect mapping (non-gapped alignment) GTXX r GTXX GTXX AG GTXX e1 e2 GTXX r Correct mapping (spliced alignment) (1) Read r may be incorrectly mapped to the intron between exons e1 and e2. Gene e1 e2 e3 Read mapped e1 e2 e3 Processed pseudogene (2) Here, the read shown in red, which spans a splice junction, can be aligned end-to-end to a processed pseudogene. Read Exon Intron
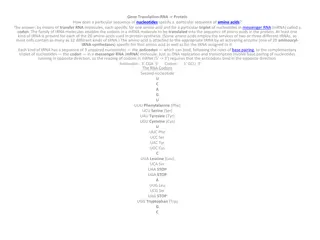
1) transcriptome mapping, which is used only when annotation is provided 2) genome mapping 3) Split read alignment of step 2 unmapped -novel splice sites are differentiated from indels and fusions using known junction signals (GT-AG, GC-AG, and AT- AC) supported by islands and spliced alignments 4) Remapping of unaligned and previously poor mappings 5) Statistical assessment to assign most likely alignment of multi-mappers
Example Concordant Gene V2 V1 http://www.broadinstitute.org/igv/
Alignment Comparison Engstrom et al., Nature Methods 10, 1185-1191 (2013)
Alignment Comparison Splice Junction Accuracy Engstrom et al., Nature Methods 10, 1185-1191 (2013)
Many RNAseq Aligners Systematic evaluation of spliced alignment programs for RNA-seq data. Engstr m et al, Nature Methods 2013 Shown is the percentage of sequenced or simulated read pairs (fragments) mapped by each protocol. Protocols are grouped by the underlying alignment program (gray shading). Protocol names contain the suffix ann if annotation was used. The suffix cons distinguishes more conservative protocols from others based on the same aligner. The K562 data set comprises six samples, and the metrics presented here were averaged over them.
Computational Processing Technical variation (batch effects) from library preparation and sequencing are small, and the sequencing strategy directs the level of repeatability and detection, especially depth The raw results of sequencing require significant computational processing Alignment : Maximizing unambiguous alignments; Alignment of reads that cross exon junctions; Ex: Bowtie, BWA, TopHat Abundance estimation : Gene or transcript; Handling alignments that are ambiguous in the transcriptome; Ex: Sailfish, RSEM, Cufflinks, MISO, IsoEM, IsoInfer, Rseq, . . . Normalization of read counts : Minimizing bias due to variation in number of clusters available; Ex: Total count (RPM), Upper quartile, quantile, density Different algorithmic and computational strategies, especially the transcriptome definition, impact performance much more than SE vs. PE, 50 bp vs. 100 bp.
Multireads: Reads Mapping to Multiple Genes/Transcripts 350 200 1 Long 150 100 300 2 Medium Multireads 50 200 3 Short Unique Relative abundance for these genes, f1, f2, f3 N
Approach 1: Ignore Multireads 350 200 1 Long 150 100 300 2 Medium 50 200 3 Short Relative abundance for these genes, f1, f2, f3 Nagalakshmi et. al. Science. 2008 Marioni, et. al. Genome Research 2008 N
Approach 1: Ignore Multireads 350 200 1 Long 150 100 300 2 Medium 50 200 3 Short Over-estimates the abundance of genes with unique reads Under-estimates the abundance of genes with multireads Not an option at all, if interested in isoform expression N
Approach 2: Allocate Fraction of Multireads Using Estimates From Uniques 350 200 1 Long 150 100 300 2 Medium 50 200 3 Short Relative abundance for these genes, f1, f2, f3 Ali Mortazavi, et. al. Nature Methods 2008 Sailfish, RSEM,Cufflinks N
Multireads: Reads Mapping to Multiple Genes/Transcripts Long Medium Wang X, Wu Z, Zhang X. Isoform abundance inference provides a more accurate estimation of gene expression levels in RNA-seq. J Bioinform Comput Biol. 2010 Dec;8 Suppl 1:177-92. PubMed PMID: 21155027. N
Cufflinks PMID: 20436464
Li and Dewey, 2011 PMID: 21816040 RSEM irepresents the probability that a fragment is derived from transcript i A) PE isoform; B) PE gene; C) SE isoform; D) SE gene
Current Methods RSEM demonstrated high accuracy as part of MAQC experiment, but run time scales exponentially with read count and transcript definitions eXpress EM similar to RSEM, but processes reads in a streaming fashion Initial evidence was that eXpress / sailfish / Kallisto demonstrated a drop in accuracy relative to RSEM. Sailfish EM similar to RSEM, but replace approximate alignment of reads with exact alignment of k-mers Then . . . Kallisto similar to sailfish, but further reduced alignment complexity (very fast!) Salmon uses a combination of alignment informed k-mer matching and a combination of the Kallisto variational Bayes approach with a local EM approach
Salmon Novelties Streaming variational Bayes (VB) inference combined with batched VB or EM Lightweight alignment through maximal exact matches Transcript / gene abundance inference is abstracted from the alignment step [RSEM also permits this; sam-xlate in https://github.com/mozack/ubu/wiki]
Computational Processing Technical variation (batch effects) from library preparation and sequencing are small, and the sequencing strategy directs the level of repeatability and detection, especially depth The raw results of sequencing require significant computational processing Alignment : Maximizing unambiguous alignments; Alignment of reads that cross exon junctions; Ex: Bowtie, BWA, TopHat Abundance estimation : Gene or transcript; Handling alignments that are ambiguous in the transcriptome; Ex: Sailfish, RSEM, Cufflinks, MISO, IsoEM, IsoInfer, Rseq, . . . Normalization of read counts : Minimizing bias due to variation in number of clusters available; Ex: Total count (RPM), Upper quartile, quantile, density Different algorithmic and computational strategies, especially the transcriptome definition, impact performance much more than SE vs. PE, 50 bp vs. 100 bp.
Typical measures of expression FPM fragments per million - Statistical tools like DESeq and SAMseq do not utilize these transformations Quartile normalization (preferred) uses arbitrary units -
Repeatability & Detection by Isoform Database Larger reference transcriptomes result in reduced repeatability (left), but increased detection (right) Detection - 73% of RefSeq, 66% of UCSC, and 52% of Ensembl
Differential Expression Bullard JH, Purdom E, Hansen KD, Dudoit S. Evaluation of statistical methods for normalization and differential expression in mRNA-Seq experiments. BMC Bioinformatics. 2010 Feb 18;11:94. doi: 10.1186/1471-2105-11-94. PubMed PMID: 20167110; PubMed Central PMCID: PMC2838869


 30 (3): 301-304.")


")
")
 transcriptome mapping, which is used")
 transcriptome mapping, which is used")
 transcriptome mapping, which is used")