Insights on Vocalizing Baleen Whales: A Global Census Study
Exploring the use of soundscapes for a global census of vocalizing baleen whales, this study delves into the challenges of counting blue whales, the impact of vessel traffic on whale migration routes, and the conversion of sound intensity to abundance. Limitations are highlighted, such as the need for more extensive receiver coverage for accurate population estimates. Additionally, the potential of utilizing Argo floats for a global census is discussed based on measurements from 1965-2001 in the North-east Pacific region.
Download Presentation

Please find below an Image/Link to download the presentation.
The content on the website is provided AS IS for your information and personal use only. It may not be sold, licensed, or shared on other websites without obtaining consent from the author.If you encounter any issues during the download, it is possible that the publisher has removed the file from their server.
You are allowed to download the files provided on this website for personal or commercial use, subject to the condition that they are used lawfully. All files are the property of their respective owners.
The content on the website is provided AS IS for your information and personal use only. It may not be sold, licensed, or shared on other websites without obtaining consent from the author.
E N D
Presentation Transcript
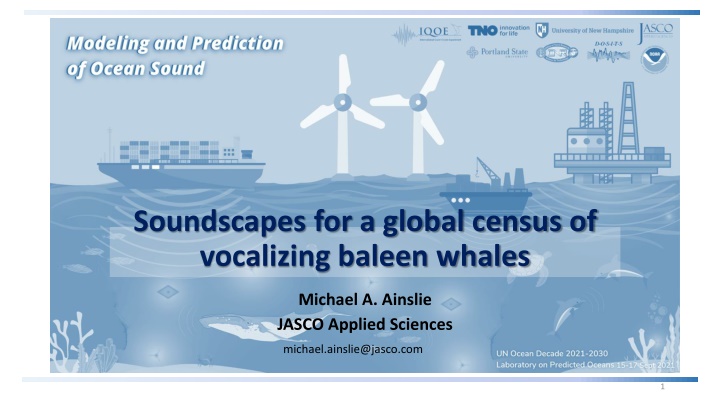
Soundscapes for a global census of vocalizing baleen whales Michael A. Ainslie JASCO Applied Sciences michael.ainslie@jasco.com 1
Introduction Blue whale Protected species Population 5-15 thousand (IUCN) How to count? Visual survey Labour intensive Local population Acoustical survey Includes sound from distant animals Global census?
Sound from ships ~ 100 Hz https://www.shipmap.org/ 3
North-east Pacific 1965-2001 Measurement locations Averaged sound spectra Andrew et al (2011) } }
Vessel traffic and whale migration routes Global shipping Blue whale migration https://www.shipmap.org/ https://www.offthemap.travel/
Converting sound intensity to abundance Average sound intensity, ? Number of sources Average sound intensity ? = ? ? Constant ~0.1 0.2 pW/m2 Number of sources, ? ? = ? /?
Converting sound intensity to abundance 37.5 Hz 55 Hz 440 Hz 110 Hz 220 Hz ? Intensity ? = ? /? 20 Hz 100 Hz (G1) Number of sources
Limitations Assume whales do not adjust calls to changing background noise Frequency Source level Source depth Duty cycle Intensity needs to be averaged over North Pacific Ocean Only 4 receivers Need 100s of receivers covering the entire ocean Depth as well as latitude and longitude overestimate whale population? 8
3900 Argo floats in 2018 https://en.wikipedia.org/wiki/Argo_(oceanography) Temperature, salinity
Conclusions Measurements for 1965-2001 suggest No. ships increased in NE Pacific (~2.5) No. whales increased in NE Pacific (~9?) But Only 4 receivers Close to migration route Overestimate Argo Potential for global census
Bibliography Ainslie, M. A., Andrew, R. K., Howe, B. M., & Mercer, J. A. (2021). Temperature-driven seasonal and longer term changes in spatially averaged deep ocean ambient sound at frequencies 63 125 Hz. The Journal of the Acoustical Society of America, 149(4), 2531-2545. Andrew, R. K., Howe, B. M., Mercer, J. A., & Dzieciuch, M. A. (2002). Ocean ambient sound: comparing the 1960s with the 1990s for a receiver off the California coast. Acoustics Research Letters Online, 3(2), 65-70. Andrew, R. K., Howe, B. M., & Mercer, J. A. (2011). Long-time trends in ship traffic noise for four sites off the North American West Coast. The Journal of the Acoustical Society of America, 129(2), 642-651. Burtenshaw, J. C., Oleson, E. M., Hildebrand, J. A., McDonald, M. A., Andrew, R. K., Howe, B. M., & Mercer, J. A. (2004). Acoustic and satellite remote sensing of blue whale seasonality and habitat in the Northeast Pacific. Deep Sea Research Part II: Topical Studies in Oceanography, 51(10-11), 967-986. McDonald, M. A., Hildebrand, J. A., & Wiggins, S. M. (2006). Increases in deep ocean ambient noise in the Northeast Pacific west of San Nicolas Island, California. The Journal of the Acoustical Society of America, 120(2), 711-718. Reilly, S., Bannister, J., Best, P., Brown, M., Brownell Jr, R., Butterworth, D., ... & Urb n, J. (2008). IUCN red list of threatened species, chapter Balaenoptera musculus. Stafford, K. M., Mellinger, D. K., Moore, S. E., & Fox, C. G. (2007). Seasonal variability and detection range modeling of baleen whale calls in the Gulf of Alaska, 1999 2002. The Journal of the Acoustical Society of America, 122(6), 3378-3390.
Thank you 12
SPARE SLIDES 13
Spare: Mercator projection Spilhaus projection https://www.shipmap.org/ Applied Ocean Sciences
Spare: Blue whale abundance since 1990s Has the California blue whale population stopped growing? 4000 2000 Blue whale abundance Eastern North Pacific Stock NMFS (2020) 0 2000 1990 2010 Low frequency ocean sound from shipping and baleen whales 16
Spare: California blue whale population Population estimates Sightings
Spare: 20-month time series: 1998- 1999 LF (16 Hz), Aug-Nov HF (80 Hz), peak in March Washington Point Sur San Nicolas Low frequency ocean sound from shipping and baleen whales 18
Spare: 25-150 Hz sounds 80 Hz 25-150 Hz Sonic Electronix
Spare: Converting sound intensity to abundance Average sound intensity ( ? ) Number of sources Average sound intensity ? = ? ? Constant Number of sources (?) ? 4?? ? = ? = ocean volume (0.3 Mm3) ? = absorption coefficient (0.3-0.4 Np/Mm) ? = source power 40 mW (whale) 50-60 mW (ship) WEG ? = ? /?
