Importance of Census Evaluation in Ensuring Data Quality
A population and housing census involves various complex steps where errors can occur. Evaluating the census is crucial to assess the effectiveness of operations and systems, identify strengths and weaknesses, and improve data quality for future censuses. By establishing a comprehensive evaluation programme early on, stakeholders can obtain valuable insights to enhance census processes and ensure reliable data outcomes.

Download Presentation

Please find below an Image/Link to download the presentation.
The content on the website is provided AS IS for your information and personal use only. It may not be sold, licensed, or shared on other websites without obtaining consent from the author.If you encounter any issues during the download, it is possible that the publisher has removed the file from their server.
You are allowed to download the files provided on this website for personal or commercial use, subject to the condition that they are used lawfully. All files are the property of their respective owners.
The content on the website is provided AS IS for your information and personal use only. It may not be sold, licensed, or shared on other websites without obtaining consent from the author.
E N D
Presentation Transcript
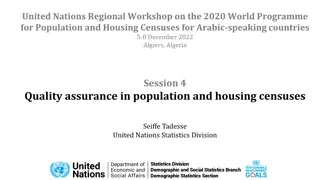
United Nations Regional Workshop on the 2020 World Programme for Population and Housing Censuses for Arabic-speaking Countries 5-8 December 2022 Algiers, Algeria Evaluation of the quality of census processes and census data Meryem Demirci UN Statistics Division Statistics Division
Introduction A population and housing census consists of a complex series of interrelated steps, and errors can and do occur at all stages of the census operation Every census needs to be evaluated based on agreed indicators and planned achievements Evaluation is generally regarded as the last stage of the census cycle or the first step in the next census cycle Statistics Division
Why do we need to evaluate the census? Evaluation assesses the effectiveness of operations, systems and processes and their likely impact on data quality Assessments provide valuable information on strengths and weaknesses of past operational procedures, and identification of types and sources of errors which should be carefully reviewed prior to the development of the next census in order to assist with the planning of future censuses and better design of census operation o Especially when changes new procedures, new technologies, new topics- have been introduced compared to the previous census This evaluation provide users with a measure of the quality of census data to help them interpret the results Statistics Division
Evaluation programme A census evaluation programme should be developed early enough as part of the overall programme and integrated with other census activities A team responsible for the planning , organization and implementation of the evaluation programme should be established A comprehensive evaluation programme should include: Evaluation of census processes operational assessments Evaluation of the quality of products/outputs- assessment of coverage and content errors and the quality of other dimensions The results of evaluations of census operation for both operational aspects and the quality of data should be made available to the stakeholders Statistics Division
Generic statistical processes for censuses Quality management and assessment Metadata management Questionn aire Planning Mapping Testing Pre-enumeration operations Enumerati on Data Disseminat ion Analyzing Evaluation processing Extensive evaluation of data quality and census processes, to document lessons learned and plan future censuses Quality assessment for coverage and content errors Statistics Division
UNSD methodological framework for PHC Principles and Recommendations for Population and Housing Censuses, Revision 3 Principles and Recommendations for Population and Housing Censuses, Revision 3 (2015) (2015) Handbook on Management of Population and Housing Censuses, Revision 2 Handbook on Management of Population and Housing Censuses, Revision 2 (2016) (2016) Technical Technical Report on Report on Measuring Measuring SDG SDG Indicators Indicators through through Population Population and Housing and Housing Censuses and Censuses and Civil Civil Registration Registration Data Data (2021) (2021) NEW NEW Guidelines on Guidelines on the Use of the Use of Electronic Electronic Data Data Collection Collection Technologies Technologies in Population in Population and Housing and Housing Censuses Censuses (2019) (2019) Guidelines on Guidelines on the use of the use of registers and registers and administrativ administrativ e data for e data for population population and housing and housing censuses censuses (ECE 2018) (ECE 2018) Handbook on Handbook on Registers Registers- - based based Population Population and Housing and Housing Censuses Censuses Handbook on Handbook on GIS in GIS in support of support of Census Census Activities Activities (2009) (2009) Handbook on Handbook on Measuring Measuring International International Migration Migration through through censuses censuses (2017) (2017) Handbook on Handbook on Editing for Editing for Population Population and Housing and Housing Censuses, Censuses, Revision 2 Revision 2 (2019) (2019) Technical Technical Report on Report on Post Post Enumeration Enumeration Surveys Surveys (2010) (2010) (Draft) (Draft) Under review Under review NEW NEW NEW NEW NEW NEW NEW NEW NEW NEW Statistics Division Demographic and Social Statistics Branch Demographic Statistics Section
Evaluation Operational aspects/processes P&R recommends that the census evaluation programme should be undertaken by subject specialists according to the agreed goals and methodologies covering all possible dimensions of quality. Some examples of areas for evaluation include: Relevance of census data to user needs and satisfaction of users with dissemination tools and products (based on information collected through user consultation); Achievements and difficulties in use of new technologies and methodologies and identification of improvements for the next census; Identification of the deficiencies and achievements in data capture, coding and editing; Realization of the census calendar, including the calendar of releasing census results, and, in the case of changes to the calendar, the reasons and consequences Statistics Division
Evaluation Data quality P&R recommends that Evaluation of the accuracy of the census data should be undertaken, to the extent possible, by: conducting a post enumeration survey for measuring coverage and content errors, comparing the census results with similar data from other sources (surveys and administrative records in a similar time frame & previous census results) and applying demographic analysis Evaluation of the quality of census data should be undertaken considering all dimensions of the quality in addition to accuracy, such as timeliness, comparability, relevance, etc. Statistics Division
Quality assessment dimensions Relevance - the degree to which statistical outputs meet current and potential user needs, in terms of data availability, concepts and definitions Relevance Accuracy and reliability- the degree to which the information correctly describes the phenomena Timeliness/ punctuality Accuracy /reliability Timeliness and punctuality- the delay between the date to which the data refer (census day) and the date on which the information becomes available Quality Coherence and comparability- the degree to which data that are derived from different sources or methods, are similar- the degree of consistency across data sources Coherence /comparabili ty Accessibility /interpretabi lity Accessibility and interpretability- the ease with which users are able to access census data-the easy with which the existence of data and metadata can be ascertained by the users Statistics Division
Evaluation of operational aspects/processes - 1 Relevance of topics selected for data collection Ensuring the content of the questionnaire is relevant to users and meets with the requirements outlines in census legislation The key process is extensive consultation with actual and potential users- user consultation programme Consultation with users in different formats: consultations with key government departments and agencies; advice from professional advisory committees in major subject matter areas; user feedback; ad hoc consultations with interested groups; Methods: Meetings, surveys Assessment of quality preparing a report on user consultation programme, achievements, failure in inclusion of some topics and reasons Statistics Division
Evaluation of operational aspects/processes - 2 Form Design and Testing Testing of each census question and testing of the design The results of each test being analyzed and necessary changes made using quality circle approach Evaluation of improvements in census questionnaire and satisfaction of key internal stakeholders o The dissemination team- ensuring to meet with the needs of users o The subject matter specialist team; o The team of the data capture or processing system o The field operations team o The respondents -- to ensure that the forms are easy to complete- self enumeration mail out/mail back and Internet Assessment report on satisfaction and improvements Statistics Division
Evaluation of operational aspects/processes - 3 Mapping Evaluation of the quality of maps contains a set of processes and conventions that ensure that the census maps that are developed in the census cartographic process conform to the defined accuracy standards. Some examples of areas for evaluation How many months before the enumeration mapping has been completed- international recommendation 6 months before Coverage of residential and non-residential places Accuracy of the boundary of an EA Whether basemap imagery (if available) recent enough to provide useful context for EA recognition Level of update of housing units/institutional places during field enumeration Evaluation report on the quality of census maps and potential areas for improvements Statistics Division
Evaluation of operational aspects/processes - 4 Printing and distribution/collection of census questionnaires/materials/data collection devices (tablets) Establishment of a system for monitoring the quality of printing (if applicable) and distribution/collection of census materials o Regular check of the quality of the printed documents, monitoring the progress in printing o Monitoring distribution of census to final destination by timing, number and types of materials/equipment o Monitoring collection of census materials by timing, numbers and other issues such as broken devices o Monitoring the quality of work of companies, field staff based on the set targets Evaluation report on the quality of printing and timely distribution of enough materials and collecting all materials from the field Statistics Division
Evaluation of operational aspects/processes - 5 Enumeration o Checking the quality of the work of enumerators - coverage/content o Collecting periodical information from enumerators/ supervisors to assess the progress in enumeration- through management and information system o Collecting information on number of enumerated population/housing units, refusal, housing units with no contact o Monitoring non-response and follow-up rates and implementing special procedures o Monitoring number of enumerated persons and housing units by different data collection modes (CAPI, PAPI, CASI, PASI, CATI) o Monitoring the duration needed for completing enumeration- if not as scheduled, Evaluation report based on information collected during enumeration-especially on census coverage and the quality of the work of field staff Statistics Division
Evaluation of operational aspects/processes - 6 Data capture, coding and editing/imputation o Procedures should be developed with a view to minimizing the risk of erroneously cancelling, losing or artificially creating households/individuals during data processing o Procedures for monitoring the quality of each phase- data capture, coding, editing and imputation o Identifying systematic errors and taking necessary actions Evaluation report for systematic errors and the quality of data capture, coding and editing/imputation procedures, to be able to improve data processing procedures in next census Statistics Division
How to assess the quality of editing/imputation procedures Summary indicators at the variable level Maximum absolute percent change o Maximum absolute percent change across all categories for each variable Dissimilarity Index o Degree of change of two distributions (observed and total including imputed values) at the variable level Imputation rate o Share of the imputed records in the total records
Comparison of imputation rate and dissimilarity index High rate, High DI 12 High rate, Low DI 10 8 6 4 2 0 Citizenship (Albania) Had live-born children Family nucleus Highest Place of Had a job last week of September Ownership of the dwelling Use of agricultural land completed level of education residence, 2001 Imputation Rate Dissimilarity Index Source: Albania, Quality Dimensions of 2011 Population and Housing Census, May 2014
Evaluation of operational aspects/processes - 7 Dissemination The dissemination team is responsible for the timely delivery of products and services to the census data users Management of the quality in census dissemination is driven by concerns to: deliver relevant products and services while maintaining accuracy of the data, timeliness, interpretability, comparability and accessibility of census results Assessment report on timely dissemination of census products and relevant tools for ensuring that the results are accessible to users Statistics Division
Evaluation of the quality of census data Estimate coverage error and content at national and relevant sub-national level (regional, urban/rural, etc.) Analyze evidence of age misreporting and consistency between data items of a person and between household members Compare census data with independent data sources (surveys, registers) or previous censuses to: understand any significant differences explain to users why census results are different compared to other relevant data sources Adjust census data, if necessary, for population estimate/projections Statistics Division
What are typical census errors Coverage errors: Errors in the count of persons or housing units resulting from cases having been missed or counted erroneously, resulting usually from the quality of maps, mistakes made by enumerators and/or respondents intentionally or unintentionally , Content errors: Errors in the recorded characteristics of persons or housing units resulting from the interview (enumerators/respondents), coding, editing, etc. Statistics Division
Methods of quality assessment Single Source of Data (rely only on the census being evaluated) Demographic analysis Empirical Consistency checks Comparison with theoretical models Multiple Sources of Data Non-matching studies Demographic analysis using multiple census rounds Comparison with administrative sources or existing surveys Matching studies Post Enumeration Surveys (PES) Record checks Records checks Birth registration School enrollment National identification cards/registers Immigration registers Voter registration lists Health or social security records Statistics Division
Assessing the quality of Age-Sex Basic tools Possible data errors in the age-sex structure, including Age misreporting (age heaping and/or age exaggeration) Coverage errors net under/over enumeration(by age or sex) Significant discrepancies in age-sex structure due to extraordinary events High migration, war, famine, HIV/AIDS epidemic etc. Graphical analysis o Population pyramids o Graphical cohort analysis Age and sex ratios Summary indices of error in age-sex data o Whipple s index o Myers Blended Method Uses of consecutive censuses Statistics Division
Cohort analysis Tracking actual cohorts over multiple censuses Data is organized by birth cohort The size of each cohort should decline over each census due to mortality, with no significant international migration Exclude open-ended age category New cohorts will be added and older cohorts will be lost as we progress to later censuses The age structure (the lines) for censuses should follow the same pattern in the absence of census errors People who were born in the same years are compared in the analysis An important advantage - possible to evaluate the effects of extraordinary events and other distorting factors by following actual cohorts over time Statistics Division
Cohort analysis Males Females 2000 2000 Thousands Thousands 1998 and 2008 censuses of Algeria 1500 1500 1000 1000 500 500 0 0 Birth cohort Male-1998 Male-2008 Female-1998 Female-2008 Age increases Statistics Division
Summary indices Whipple`s index Developed to reflect preference for or avoidance of a particular terminal digit or of each terminal digit Ranges between 100, representing no preference for 0 or 5 and 500, indicating that only digits 0 and 5 were reported in the census If heaping on terminal digits 0 and 5 is measured; P P + + + + ( ...... ) P P P P 25 30 55 60 100 Index= + + + + + / 1 ( ) 5 ( ....... ) P P P 23 24 60 61 62 Statistics Division
Post Enumeration Survey PES entails the complete re-enumeration of a representative sample of the population, which is then matched to the corresponding records from the census enumeration PES can fulfill multiple objectives: o Assess the degree of coverage of the enumeration o Assess implications of coverage error for usefulness of the data o Examine characteristics of those who have been missed by the enumeration Develop recommendations for design of future censuses and surveys In certain circumstances, the results of the PES may be used to adjust census results Statistics Division
Post Enumeration Survey The PES should be independent of the census A survey is conducted using a sampling frame independent of the census. Persons from this survey are then matched to the census to estimate the number of persons missed or erroneously enumerated in the census Advantages: The results of a PES (with a component that is a re-interview survey) can be used to separately evaluate coverage vs. content error and net vs. gross error Incorporates matching of individuals or units between the census and PES this allows for a direct comparison of results Its results are generally more reliable than those of the census Statistics Division
Post Enumeration Survey Challenges: Requires highly skilled field and professional staff Matching is complex and costly To be valid, the PES has to be conducted in a short time after the census to limit the complicating effects of population change, recall bias etc. Statistics Division