Food Webs and Trophic Levels in Ecosystems
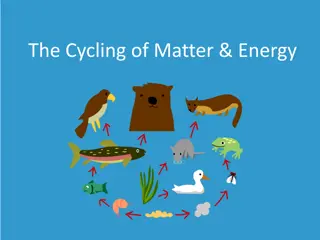
Food webs illustrate the flow of nutrients and energy between different organisms in an ecosystem. At the base of a food web are the primary producers, while predators occupy the top. If baleen whales were to go extinct, it could disrupt the balance of their ecosystem. Biomass decreases as energy is lost moving up trophic levels. Understanding trophic efficiency helps measure energy transfer in food chains. Differences in trophic efficiency between open ocean and upwelling areas affect fish production.

Download Presentation

Please find below an Image/Link to download the presentation.
The content on the website is provided AS IS for your information and personal use only. It may not be sold, licensed, or shared on other websites without obtaining consent from the author.If you encounter any issues during the download, it is possible that the publisher has removed the file from their server.
You are allowed to download the files provided on this website for personal or commercial use, subject to the condition that they are used lawfully. All files are the property of their respective owners.
The content on the website is provided AS IS for your information and personal use only. It may not be sold, licensed, or shared on other websites without obtaining consent from the author.
E N D
Presentation Transcript
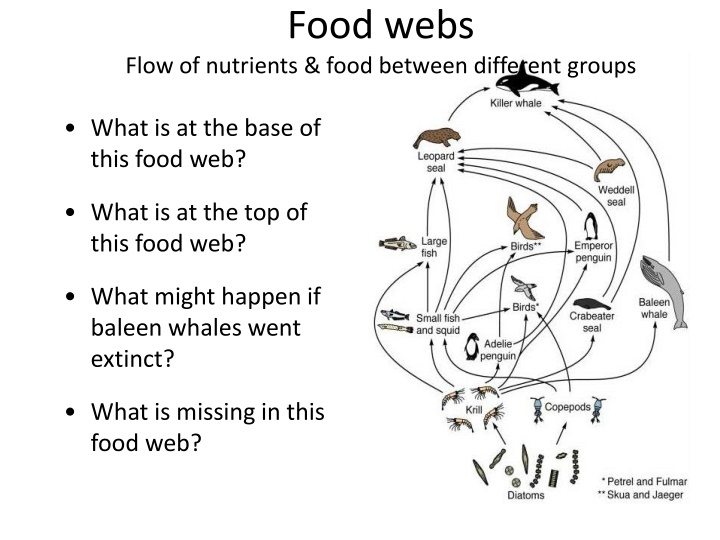
Food webs Flow of nutrients & food between different groups What is at the base of this food web? What is at the top of this food web? What might happen if baleen whales went extinct? What is missing in this food web?
Trophic levels Nutrients, organic matter, and energy move through food chains Trophic levels establish the links in the food chains Have to identify feeding relationships and energy transfer pathways
Biomass Biomass decreases moving from the first trophic level with the primary producers up to higher trophic levels Why does biomass decrease moving through a food chain? We may add 1 kg of weight after eating 10 kg of fish; why don t we gain exactly 10 kg?
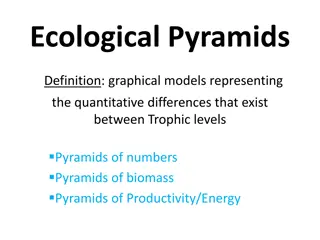
Trophic pyramid Trophic pyramid tracks the levels in a food chain Primary producers are at the base of the trophic pyramid Going up a trophic pyramid: Biomass decreases Energy is lost Nutrients are recycled
Trophic efficiency Trophic efficiency measures how much energy and mass is transferred to each successive level For this simple food chain example: Phytoplankton (diatoms): 100 g C/m2/year Zooplankton (copepods): Fish (anchovies): 10 g C/m2/year 1 g C/m2/year
Trophic efficiency Only 10% to 20% of energy and mass is transferred from one trophic level to the next Upwelling areas are smaller in size, but have higher trophic efficiency, and fewer trophic levels than open ocean trophic pyramids Which area will have the highest fish production?
Open ocean: Primary productivity = 81% of total Fish production = < 1% of total Large area for increased productivity, but more trophic levels with lower transfer efficiency
Upwelling: Primary production = 0.5% of total Fish production = 50% of total Small area, but few trophic levels, high transfer efficiency
Coastal food web More trophic levels and moderate trophic efficiency (15% efficiency) 3.4 g C of herring are produced from 1000 g of phytoplankton
Open ocean food web Many trophic levels and low trophic efficiency (10% efficiency) 0.1 g C of tuna produced from 1000 g C of phytoplankton Population densities are low so more effort expended in searching for food