Insights from City of Olathe's Neighborhood Park Usage Study

 
City of Olathe’s
Neighborhood Park Usage
Study
 
By Ed Foley & Paul Krueger
Introductions
 
How did this happen? – One unanswered question
https://youtu.be/IG5meEV1rUE


Bottom Line Up Front
 
We have to fight for resources – Doesn’t everybody???
Management Decisions
If we are going to do it, it should be done right
Background
 
Neighborhood Parks are hard to track
Not doing has been a missed opportunity
 
How Did we do it?
 
Listed all 27 Neighborhood Parks
Created 3 Daily Time segments
Created 3 Seasonal Time Segments
Considered factors such as amenity usage, unique usage, hourly snapshots,
and weather considerations
Randomized the schedule and assigned dates to complete 300
observations over 3 years with the goal of conducting about 2 counts per
week every week, year round
What did we learn?
 
Growing Pains
Tertiary Benefits are Powerful
So, where does ClearPoint come in?
 
The Power of Automation
Data Dive
The Data
 
Three data sets visualized in 
ClearPoint
Park Usage
Amenities Usage
Weather
So, did we answer the main question?
 
With all the pretty charts we almost forgot to measure our first question –
How many people visit our Neighborhood Parks in a:
Year
Day
Hour
 
Can we answer Your Questions???
 
Thank You
 
Neighborhood Park Visitors
 
Amenity Usage
 
Amenity Usage
 
Weather
 
Weather
 
Background
 
The Parks and Recreation department at the City of Olathe is conducting a
series of 300 surveys of 27 parks to gather insight about visitation and amenity
usage in the neighborhood parks in the city.
The main question the department is looking to answer is how many people use
the City’s neighborhood parks during a year?
Tracking neighborhood parks is more difficult than tracking larger parks.
The department sends out people to survey the parks because many of the
parks have small or no parking lots, don’t have restrooms, and have limited
amenities such as just a small shelter and a playground.
Gathering this data will help the department determine high and low usage
rates by park, attain resources, be good stewards, and make informed
decisions dealing with neighborhood parks. Ex. Installing a new playground
 
Design of the Survey
 
The certain park, time of day, and date for each survey were all randomly
chosen. This is to reduce bias such as just surveying on good weather days.
The time period these surveys take place is July 2017 to June 2020.
The three time periods during the year used for the study are: July-October,
November through February, and March through June.
The periods are divided this way because these months are similar to each
other as far as usage in the parks. Ex. Spring activities March to June
The survey has three day time periods: morning (8:00am-11:59am), mid-day
(12:00pm-3:59pm), and evening (4:00pm-7:59pm).
This survey has a few main sections to it: visitor usage, amenity usage, and
weather. These will be discussed later in the presentation.
 
Survey Procedure
 
The Parks and Recreation department utilizes their safety aid employees to
conduct surveys because they have turned out to be more reliable than
using volunteers.
The surveyor goes out in a park ranger vehicle to the designated
neighborhood park during the specific time frame to record the responses
to the different questions.
The surveyor then returns the survey to the Parks and Recreation
Department to be entered into the Excel file created to hold the data.
This data is then loaded into ClearPoint to summarize findings.
 
Survey Visitor Usage Data
 
One of the major focuses of the survey is to track the amount of visitors
coming to each park.
A visitor is any person who visits the park. The visitors are then divided into
two measures: unique users and all present users.
Unique users are how many people visit the park with no repeats.
All Present users are how many people are counted at the top of each
hour for the survey. This measure includes repeats.
The unique users are averaged for each month, and then a rolling average
is taken to see how each month compares to the overall.
 
Survey Visitor Usage Data Graph
 
Survey Amenity Usage Data
 
Another major focus of the survey is to see how often amenities are being
utilized and at what times of the day they are being used.
Four amenities are measured: shelters, playgrounds, trails, and other.
These four amenities are then evaluated to see what percent of the time
they are being used.
The amenities are paired up by the different survey times per amenity and
are compared against each other in graphs.
This helps show what times of day certain amenities are popular, and it
compares which amenities are being used more than others.
 
Survey Amenity Usage Data Graph
 
Survey Amenity Usage Data Graph
 
Survey Weather Data
 
The last major focus of the survey is weather. Weather measures are taken
to see if this affects how many visitors attend a park.
The three main weather measures taken are: temperature, humidity, and
wind speed.
Observations of bad weather are also recorded which include: rain/mud,
snow/ice, and wind at or over 25mph.
The observations of bad weather data is combined with the unique users
data to see how often people visit on good days vs. bad days.
 
Survey Weather Data Graph
 
Survey Weather Data Graph
 
Thank you!
 
Slide Note
Embed
Share

Explore the comprehensive Neighborhood Park Usage Study conducted by Ed Foley & Paul Krueger in City of Olathe. The study delves into how park resources are managed, the challenges faced in tracking neighborhood park usage, the methodology used for data collection, key findings on growing pains and powerful tertiary benefits, and the integration of ClearPoint for data visualization and analysis. Discover the importance of answering crucial questions regarding park visitors and amenity usage through detailed data analysis.

  • Neighborhood Park Study
  • Data Analysis
  • Resource Management
  • ClearPoint Integration

Uploaded on Nov 15, 2024 | 0 Views


Download Presentation

Please find below an Image/Link to download the presentation.

The content on the website is provided AS IS for your information and personal use only. It may not be sold, licensed, or shared on other websites without obtaining consent from the author. Download presentation by click this link. If you encounter any issues during the download, it is possible that the publisher has removed the file from their server.

E N D

Presentation Transcript


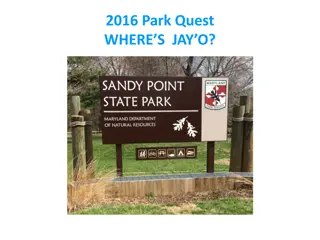
  1. City of Olathes Neighborhood Park Usage Study By Ed Foley & Paul Krueger

  2. Introductions How did this happen? One unanswered question https://youtu.be/IG5meEV1rUE

  3. Bottom Line Up Front We have to fight for resources Doesn t everybody??? Management Decisions If we are going to do it, it should be done right

  4. Background Neighborhood Parks are hard to track Not doing has been a missed opportunity

  5. How Did we do it? Listed all 27 Neighborhood Parks Created 3 Daily Time segments Created 3 Seasonal Time Segments Considered factors such as amenity usage, unique usage, hourly snapshots, and weather considerations Randomized the schedule and assigned dates to complete 300 observations over 3 years with the goal of conducting about 2 counts per week every week, year round

  6. What did we learn? Growing Pains Tertiary Benefits are Powerful

  7. So, where does ClearPoint come in? The Power of Automation Data Dive

  8. The Data Three data sets visualized in ClearPoint Park Usage Amenities Usage Weather

  9. So, did we answer the main question? With all the pretty charts we almost forgot to measure our first question How many people visit our Neighborhood Parks in a: Year Day Hour

  10. Can we answer Your Questions??? Thank You

  11. Neighborhood Park Visitors

  12. Amenity Usage

  13. Amenity Usage

  14. Weather

  15. Weather

Related


More Related Content

giItT1WQy@!-/#giItT1WQy@!-/#giItT1WQy@!-/#