Insights from ATLAS Preliminary Survey Results
Preliminary results from the survey conducted by Prof. Dr. Evangelia Demerouti and Lotte Kersten reveal the inclusion of various aspects in the questionnaire: positive attitude towards change, employee perspective, job crafting, adjustments, organizational resources, job engagement, and demands. The presentation entails an overall comparison of the total cohorts, analysis of evaluation changes over time, and recommendations. The participants were diverse, with significant gender representation, age range, supervisory roles, and work setups. The effects of external and internal factors on attitude towards the move to ATLAS were also explored.
Download Presentation

Please find below an Image/Link to download the presentation.
The content on the website is provided AS IS for your information and personal use only. It may not be sold, licensed, or shared on other websites without obtaining consent from the author.If you encounter any issues during the download, it is possible that the publisher has removed the file from their server.
You are allowed to download the files provided on this website for personal or commercial use, subject to the condition that they are used lawfully. All files are the property of their respective owners.
The content on the website is provided AS IS for your information and personal use only. It may not be sold, licensed, or shared on other websites without obtaining consent from the author.
E N D
Presentation Transcript
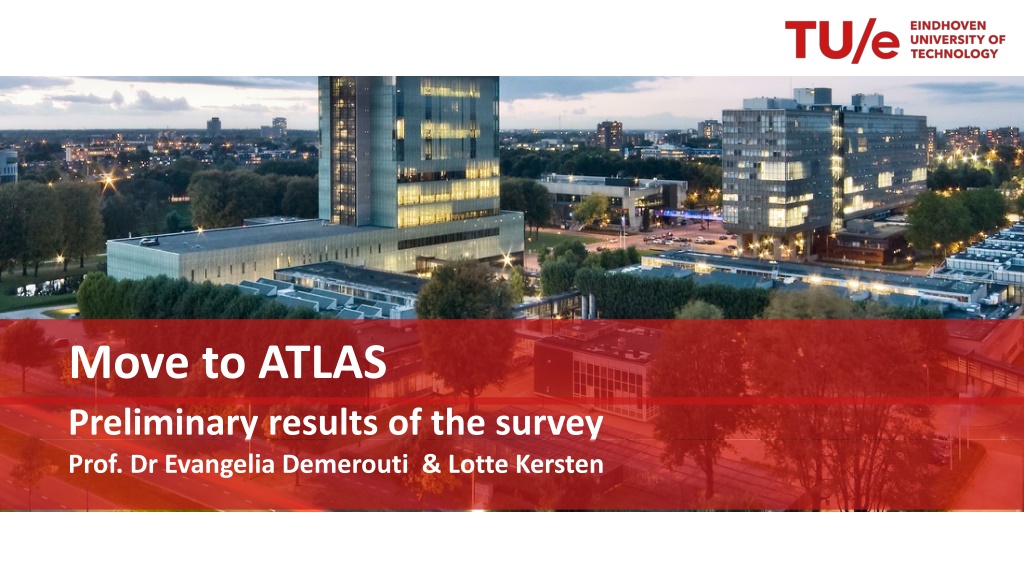
Move to ATLAS Preliminary results of the survey Prof. Dr Evangelia Demerouti & Lotte Kersten
What was included in the questionnaire? Positive attitude towards change/ATLAS (AT) Employee perspective Job crafting (SR, ,RD,OD) Adjustments (FIND1.2, INT, SAT, EX, TASK, HELP,TID,RI) Organizational Resources (SUP,ATM,COM) Job Engagement (VIG, DED,) Demands (WINT, WF,CLIM, WS,PRIV) Move to ATLAS 2
In todays presentation - Overall comparison of the total cohorts of the first and second survey - Analysis of changes in evaluation of participants over time who participated twice - Recommendations Move to ATLAS 3
Who participated? 606 respondents (within 15.05.2019 30.05.2019) 273 Supporting services and Board 31 ID scientific personnel 21 ID supporting services 117 IE&IS scientific personnel 37 IE&IS departmental staff 124 missing 62% indicates they also participated in the first survey Move to ATLAS 4
Characteristics of participants Gender: 40.9% men, 56.2% female, 2.1% other Age: 26 33 years 17.0% 34 41 years 20.5% 42 49 years 19.9% 50 57 years 22.8% 58 65 years 15.8% Supervisory role: yes 25.1% Number of days working at home: 0 days 51%, 1 day 36.7%, 2 days 8.3% Current office space: individual room 7.7%, shared room 25.9%, open office 66.4% Previously: individual room 32.9%, shared room 59%, open office 8.1% Move to ATLAS 5
The effects of the external and internal factors on Attitude towards the move to ATLAS: I see the move of our faculty/department to ATLAS as a positive development Evaluation of the move to ATLAS: Overall, how satisfied are you with your workplace? The chosen workplace concept in Atlas will ensure that future employees view the TU/e as an attractive employer Overall, how positive or negative do you evaluate the move to ATLAS? Task Completion: On an average workday I perform different tasks than planned On average my tasks take longer than planned 6 Move to ATLAS
Evaluation of the move to Atlas Overall, how positive or negative do you evaluate the move to ATLAS? 100 100 43.6% < 0 17.5% = 0 38.9% > 0 35.7% < 0 14.5% = 0 49.8% > 0 90 90 80 80 70 70 60 60 50 50 40 40 30 30 20 20 10 10 0 0 -4 -3 -2 -1 0 1 2 3 4 -4 -3 -2 -1 0 1 2 3 Before move After move Move to ATLAS 7
Satisfaction of the new workplace Overall, how satisfied are you with your workplace? Scale: 1: dissatisfied 2: somewhat dissatisfied 3: Neither satisfied nor dissatisfied 4: Somewhat satisfied 5: satisfied Mean: 3.11 (SD: 1.43) Old workplace 3.99 (SD: 1.19) No significant differences between genders, office types, departments, supervisory role Move to ATLAS 8
Attitude towards the move to atlas I see the move of our faculty/department to ATLAS as a positive development Scale: 1: Totally disagree 2: Disagree 3: Somewhat agree 4: Agree 5: Totally Agree Mean: 3.07 (SD: 1.27) Old Mean: 3.06 (SD: 1.28) No significant difference between gender, office types, departments or supervisory role Title of the presentation by tab Insert -> Header text and Footer text Move to ATLAS 9
Task Completion I perform different or less tasks than planned Scale: 1: Totally disagree 2: Disagree 3: Somewhat agree 4: Agree 5: Totally Agree Mean: 3.21 (SD: 0.75) Old Mean: 3.17 (SD: 0.78) No significant difference between gender, office types or supervisory role Significantly higher for ID scientific personnel Move to ATLAS 10
Time 1 - Time 2 Comparisons: external factors, N = 174 Move to ATLAS 11
Time 1 - Time 2 Comparisons: internal factors & outcomes, N = 174 Move to ATLAS 12
External effects (current psychosocial resources) Before the move: communication, and participation were more important in employees attitude and evaluation towards the move to Atlas After the move: team climate and communication were more important in employees attitude and evaluation towards the move to Atlas as well as task completion (explained variance 35%, 36% and 20%, respectively) Move to ATLAS 13
External effects (aspects of workplace) Before the move: factors as workplace aesthetics, interaction with colleagues and facilities were more important in employees attitude and evaluation towards the move to Atlas After the move: evaluation and attitude towards the move based on: Workplace aesthetics Interactions with co-workers Facilities of workplace Explained variance Evaluation: 66% Attitude: 59% For task completion based on: Work Interruptions Interactions with co-workers Restoring information and work Explained variance 33% Move to ATLAS 14
Internal factors (well-being and job crafting) Before and after similar results Well-being: both Work Engagement (favourable) and Exhaustion (unfavourable) are significant predictors for evaluation, attitude and task completion (explained variance 15%, 10% and 1%) Job (seeking resource reducing/optimizing demands), workplace and time crafting is not a significant predictor Move to ATLAS 15
Work concept Atlas for Faculty IE&IS and ID Construct Includes T2 T1 0 50.7 % before: 1 37.2 % 0+1 80.3 % 2 8.2 % 2 13.4 % 3 2.2 % 3 2.5 % 4 0.4 % 4 0.8 % 5 1.0 % 5 2.9 % Working from home How many days per week do you work from home? ** Significance of t-test at 0.01 level Move to ATLAS 16
What type of workplaces do you miss? N = 210 Open workplaces 1.9 % Confined workplaces (in between two rooms) 20.5 % Concentration (confined) workplaces 61.4 % Closed phone call areas 68.1 % Meeting rooms (reservations via BMS) 30.5 % Not reservable meeting rooms (free walk-in) 38.6 % Informal meeting places like the round seats 18.6 % Move to ATLAS 17
Some reactions in the open space - Climate: no control over windows, curtains, temperature, light, air quality - Noise: hard to concentrate - No places to make phone calls - Meeting rooms not enough/ used by students - Not enough options for privacy - Less informal and more superficial contact (privacy / will disturb others) - Building not clean - Slow elevators and dark stairways Move to ATLAS 18
Summary of the main findings - The attitude towards the move to Atlas has remained almost the same, but is now based on different set of predictors - Task completion is worsened after the move to Atlas - External resources as communication and support of the supervisor were important predictors of the attitude before the move, now the aspects of the workplace are more important - Next to communication, team climate important external resource after the move After the more the workplace is evaluated as more aesthetic, but having good facilities, supports interaction with colleagues, the more positive the attitude and evaluation of the move but work interruptions impair task completion - Move to ATLAS 19
Summary of the main findings - Individuals factors not so important - People don t stay more often home than before - Still some room for improvement, especially in terms of - Workplace aesthetics, facilities (e.g. phone and concentration areas), interaction with colleagues (e.g. meeting places) as these are important predictors of the evaluation of and attitude towards the move Move to ATLAS 20

![[PDF⚡READ❤ONLINE] Road Atlas for the Total Solar Eclipse of 2024 - Color Editio](/thumb/21696/pdf-read-online-road-atlas-for-the-total-solar-eclipse-of-2024-color-editio.jpg)


