Improvements in Oil and Gas Emission Inventory: Uinta Basin Updates
Uinta Basin's oil and gas emission inventory has seen significant updates in 2017, focusing on improving accuracy through area-specific data collection and enhanced modeling techniques. The discrepancy between top-down and bottom-up emissions measurements has been addressed, leading to better air quality planning with minimal economic impact. Detailed analysis, operator workbooks, and sampling campaigns have contributed to a better understanding of emissions, particularly in produced water disposal facilities. These enhancements aim to provide more precise data for regulatory purposes and environmental management.
Download Presentation

Please find below an Image/Link to download the presentation.
The content on the website is provided AS IS for your information and personal use only. It may not be sold, licensed, or shared on other websites without obtaining consent from the author.If you encounter any issues during the download, it is possible that the publisher has removed the file from their server.
You are allowed to download the files provided on this website for personal or commercial use, subject to the condition that they are used lawfully. All files are the property of their respective owners.
The content on the website is provided AS IS for your information and personal use only. It may not be sold, licensed, or shared on other websites without obtaining consent from the author.
E N D
Presentation Transcript
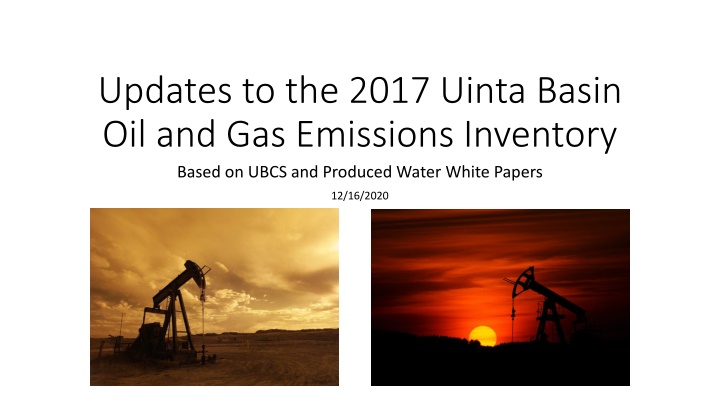
Updates to the 2017 Uinta Basin Oil and Gas Emissions Inventory Based on UBCS and Produced Water White Papers 12/16/2020
Oil and Gas Emission Inventory Improvements Ongoing inventory improvement process Trying to move away from national emission factors to area specific Bottom up emissions don t match top down observations DAQ and EPA have funded research projects and sampling campaigns to get improved scientific results Improved modeling results to better planning and rule making Leads to better air quality while minimizing economic impact
Top-down vs. Bottom-up There has been a discrepancy between top- down emissions measurements and bottom- up emissions inventories with emissions inventories of CH4 and VOC lower by factors of 4.8 and 1.8 than measurements, respectively. Ahmadov, Ravan, et al. "Understanding high wintertime ozone pollution events in an oil-and natural gas-producing region of the western US." Atmospheric Chemistry and Physics 15.1 (2015): 411-429.
Overview 2018 2019 2020 UBEI2017 Operator workbooks provided UBEI2017 Presented to Operators UBCS Report Published UBCS Sampling EPA OWDF Sampling S UDAQ OWDF Sampling Analysis & White Papers UBEI2017-Update
Produced Water Disposal Facilities Original emission factors were based on only 6 water samples New emission factors were based on nearly 500 water samples taken throughout the year
Produced Water Emission Factors Concrete Vaults and Skim Ponds
UINTAH & DUCHESNE COUNTIES UBEI2017 UBEI2017-Update Open-air oil-water separation (skim ponds) Evaporation Pond Open-air oil- water separation (skim ponds + concrete vaults) 69 Evaporation Pond (with open-air oil-water separation) 31 Evaporation Pond (with tanks) # of samples EF was based on VOC Emission Factor 2 4 382 5.292 lb/bbl 0.166 lb/bbl 47.27 lb/bbl 0.729 lb/bbl 0.355 lb/bbl Included methanol Total VOCs by process Total VOCs (TPY) NO YES 7,502 320 76,894 63.8 7,822 76,957
Uinta Basin Composition Study (UBCS) 78 wells across the Uinta Basin Representing 7 companies (3 gas- producing and 4 oil-producing) 5 geological formations
VOCs (tons/year) Uintah & Duchesne Counties Description UBEI2017 UBEI2017-Update 2017 Utah O&G EI (Operator Workbooks) Dehydrators Dehydrator Combustors Fugitives Pneumatic Controllers Pneumatic Pumps RICE & Engines Separators & Heaters Tanks (Oil and Condensate) Tanks (Water) Tank Combustors Truck Loading Well Completions (Drilling) Centrifuges Solid Waste Disposal Produced Water SUBTOTAL Emissions Reported in Operator Workbooks Capture Effectiveness Adjustment for Tank Emissions Control Effectiveness Adjustment (Water Tanks) Control Effectiveness Adjustment (Condensate Tanks) Control Effectiveness Adjustment (Oil Tanks) UDOGM Incident Reports 4,517 4,517 0 0 17,751 3,881 8,734 1,710 147 7,892 1,144 18,248 5,474 11,590 1,710 147 12,961 1,144 1 1 1,175 526 1,175 526 10 10 288 7,820 55,596 288 76,957 134,747 0 0 432 905 13,514 14,078 Midstream Vent (maintenance, startup/shutdown, malfunction) Pipeline Leaks Greenhouse Gas Emissions Reporting Program Additions Gas Well Venting (Blowdowns) Pipeline Blowdowns and Pigging EPA National Oil and Gas Tool Associated Gas Venting CBM Dewatering Pumps CBM Well Venting (Blowdowns) Mud Degassing Point Source Inventory (Reported in SLEIS) Point Sources Combined Total (Duchesne + Uintah) VOC Emissions 667 166 667 166 6,645 369 3,302 546 446 446 0 0 0 0 545 545 250 250 78,630 155,651
VOCs (tons/year) Uintah & Duchesne Counties Description UBEI2017 UBEI2017-Update 2017 Utah O&G EI (Operator Workbooks) Fugitives Pneumatic Controllers Pneumatic Pumps Tanks (Oil and Condensate) Produced Water SUBTOTAL Emissions Reported in Operator Workbooks Capture Effectiveness Adjustment for Tank Emissions Control Effectiveness Adjustment (Condensate Tanks) Control Effectiveness Adjustment (Oil Tanks) Greenhouse Gas Emissions Reporting Program Additions Gas Well Venting (Blowdowns) Pipeline Blowdowns and Pigging Combined Total (Duchesne + Uintah) VOC Emissions 17,751 3,881 8,734 7,892 7,820 55,596 18,248 5,474 11,590 12,961 76,957 134,747 432 905 13,514 14,078 6,645 369 78,630 3,302 546 155,651 2013 UB flyover: 184,511 VOC (TPY)
R. Ahmadov et al.: Understanding High Wintertime Ozone Pollution Events Source: Ahmadov et.al. 2015 (https://repository.library.noaa.gov/view/noaa/20581)
Questions ryangrant@Utah.gov lexiewilson@Utah.gov https://deq.utah.gov/air-quality/2017-statewide-oil-gas-emissions- inventory
