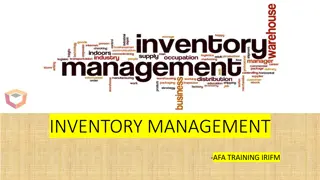
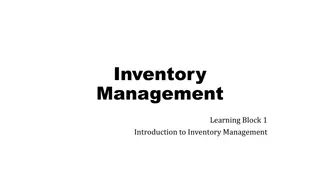
Dr. Tony Wild's Best Practices in Inventory Management
Explore the traditional inventory chain and best practices in inventory management as detailed by Dr. Tony Wild. Topics include inventory location options, the 9-box model for annual demand, supply box structure, challenges in inventory management, and availability structure. Gain insights into inventory value, sourcing problems, forecasting, and unit costs.

Download Presentation

Please find below an Image/Link to download the presentation.
The content on the website is provided AS IS for your information and personal use only. It may not be sold, licensed, or shared on other websites without obtaining consent from the author.If you encounter any issues during the download, it is possible that the publisher has removed the file from their server.
You are allowed to download the files provided on this website for personal or commercial use, subject to the condition that they are used lawfully. All files are the property of their respective owners.
The content on the website is provided AS IS for your information and personal use only. It may not be sold, licensed, or shared on other websites without obtaining consent from the author.
E N D
Presentation Transcript
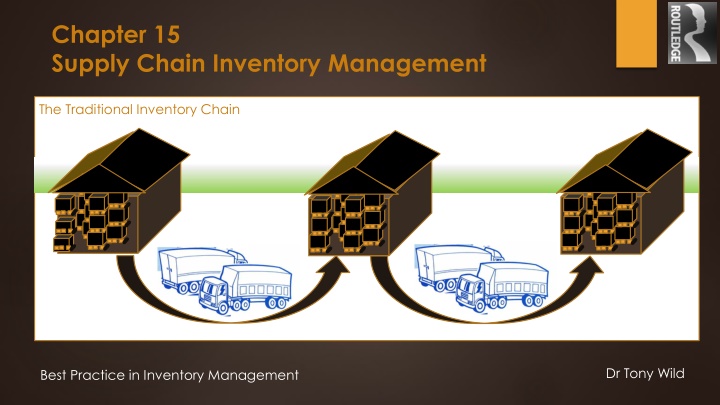
Chapter 15 Supply Chain Inventory Management The Traditional Inventory Chain 16 The Traditional Inventory Chain Dr Tony Wild Best Practice in Inventory Management
Figure 15.1 Inventory Location Options Stock in a single central warehouse Stock held in many local stores Minimum investment in stock Accurate forecasting Higher demand rate Reduced safety stocks Low warehousing costs Better formal physical control Accurate integrated system required High distribution cost to end customer Low transport cost to central warehouse Items available rapidly for customers Sensitive to local conditions Duplication of stockholding Poorer control Higher inventory investment Greater risk of obsolescence. Higher operating costs Low distribution cost to end customer High total transfer costs to local stores Dr Tony Wild Best Practice in Inventory Management
Figure 15.2 9 Box Model Annual Demand Low Value Medium Value Movers High Fast Movers Fast Value Movers Fast C B A Use logarithmic scales Medium Value Medium Movers Medium Value Sl Movers Unit Cost High Value Medium Movers High Value Slow Movers Low Medium Movers Value C B A Low Value ow Sl Movers ow C B A Dr Tony Wild Best Practice in Inventory Management
Figure 15.3 9 Box Structure for Supply Daily Hold Stock at End user interface Maintain small POS stock replenishment to POS Central or distributed stockholding Annual Demand Offer on lead time Stock at distribution Centre All time overbuy distribute as required Small stock held Centrally Make to order Unit Cost POS = point of sale to end user Dr Tony Wild Best Practice in Inventory Management
Challenges Inventory value problem Annual Demand sourcing problem Easy to forecast Availability and Difficult to forecast Unit Cost Dr Tony Wild Best Practice in Inventory Management
Figure 15.4 Availability Structure 99 % with user 99 % at user interface 95% at user interface 99% stock & fast supply Annual Demand 97% from Supply chain 99% from Supply chain 95% from Supply chain Patchy 100%or make to order 85% from Central Stock Wait lead time - Make to order Unit Cost Dr Tony Wild Best Practice in Inventory Management
Figure 15.5 Central and Local Management of Inventory Local Management Advantages Sensitivity to local conditions Customer knowledge Local commitment Responsible for Success Pragmatic Commercial Arrangements Disadvantages No overall view of inventory Expertise required at each location Potential for hoarding Different local policy implementation Central Management Advantages Good usage statistics High level of control Centre of excellence Allocate stock to greatest need Professional inventory expertise Disadvantages Lack of local knowledge Remote from customer problems Highly effective systems required Risk of incorrect local information Requires inventory control specialists Dr Tony Wild Best Practice in Inventory Management
On Site Material Inventory Options Figure 15.6 Supply Inventory Options Who Owns the Inventory Conventional Stockholding Customer owns Customer Manages VMI Customer owns Supplier Manages Customer Consignment Stock Supplier owns Customer Manages Supplier On site Stores Supplier owns Supplier Manages Supplier Customer Supplier Who Manages the Inventory Dr Tony Wild Best Practice in Inventory Management
Figure 15.7 DRP Stock and forecast demand Safety Stock Current Stock Week 5 Activity Week 1 Week 2 Week 3 Week 4 Week 6Week 7 Location Demand Requirement Demand Requirement 1 week lead time north & west 50 0 20 17 70 100 0 46 116 45 40 30 30 60 140 0 110 170 60 60 0 0 70 60 46 150 220 20 20 50 50 70 110 110 140 210 50 50 20 20 90 150 150 135 225 60 60 30 30 60 140 140 45 45 15 15 North stores 20 75 West stores 15 12 Supply 17 135 135 Demand Requirement 2 weeks lead time south stores Total Demand from Stores Central Supply WarehouseWarehouse Stock South stores 46 300 0 17 Supply 37 190 74 284 64 234 389 Deliveries planned from supplier 380 380 380 Note: Safety stock is a calculation used to trigger replenishment not a physical stock Dr Tony Wild Best Practice in Inventory Management
Figure 15.8 Fair Share Example Initial situation - Inventory available Inventory Start of Week 2 Location Warehouse Stock Deliveries from supplier North stores stock West Stores Shortage of 5 South Stores(Current stock - week 1 demand) Total Inventory Available Quantity 74 380 25 (Current stock - week 1 demand) 0 200 679 Dr Tony Wild Best Practice in Inventory Management
Figure 15.9 Fair Shares Allocation Example Total Require ment 140 83 419 642 LT ArrearsSafety Current stockTransfer Location 3 Wk Stock Stock North Stores West Stores South Stores Total Central Warehouse 20 12 46 78 60 0 110 170 20 50 150 220 40 16 113 169 25 0 200 225 115 83 219 417 5 5 37 Dr Tony Wild Best Practice in Inventory Management
Dr Tony Wild Best Practice in Inventory Management
Dr Tony Wild Best Practice in Inventory Management
Dr Tony Wild Best Practice in Inventory Management
Dr Tony Wild Best Practice in Inventory Management