Hydrographic Surveying in Geomatics Engineering

I
n
t
r
o
d
u
c
t
i
o
n
t
o
G
e
o
m
a
t
i
c
s
E
n
g
i
n
e
e
r
i
n
g
S
E
3
1
2
Hydrographic Survey
Prof. Ismat Elhassan
Introduction
•
Introduction:
•
Mapping the water floor is a specialized field of surveying, called
hydrographic surveying
. The maps that hydrographic surveyors
produce are called
nautical charts
or bathymetric maps. These, in
fact, are
topographic maps of the water bed
.
•
Hydrographic surveys include all underwater surveys encompassing
all
navigational, pipeline routing and sub marine cable installation and
dredging surveys
. It also provides data for flood
control and water
pollution control
.
•
However, typical hydrographic surveys are carried out for the purpose
of
navigation
.
Underwater Topography
•
Introduction
•
To produce a contoured
bathymetric map
of the sea bed,
known as
(Nautical Chart)
in three dimensions is a
hydrographic surveying operation which can be divided into
two main phases in general:
•
Horizontal positioning
of sounding stations (X and Y co-
ordinates); and
•
Sounding
(water depth, Z co-ordinate) determination.
Sounding
Introduction
Tidal Datum
To produce a contour map of the waterbed the third dimension
should be determined by sounding to some datum level.
The surface of the water from which the sounding is measured
cannot be used as a datum due to the continuous fluctuations of the
water level caused by tidal effects.
An arbitrary datum is chosen, normally the lowest water level and
each sounding reduced by the height of the tide above the selected
datum level to give a
reduced sounding
defined as water depth
from bottom to datum.
In general, a
datum
is a base elevation used as a reference from
which to reckon
heights or depths
.
A tidal datum is a standard elevation defined by a certain phase of
the tide.
Tidal datum
is used as reference to measure local
water levels
.
M
e
t
h
o
d
s
o
f
S
o
u
n
d
i
n
g
•
Classical Methods:
•
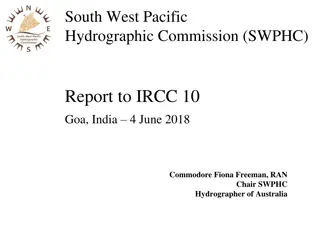
In early days
Hydrographic Surveys
involve the depth
measurement by
sounding pole
(Fig. 1) and
hand lead line
(Fig 2)
.
The reading of these survey methods are analogue in nature, and it
is a labor-intensive and time-consuming process. Thus, this
method was not that popular.
•
•
Fig. 1
•
Sounding Pole
Classical Methods
•
Fig. 2
•
Fig. 2a Lead Line Fig. 2b Lead Line in
•
operation
S
o
u
n
d
i
n
g
M
a
c
h
i
n
e
•
Lead line is further developed to sounding machine (Fig. 3)
•
Fig, 3 Sounding Machine
E
c
h
o
s
o
u
n
d
i
n
g
•
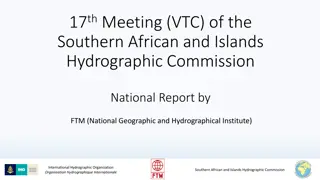
Further development lead to using sounding waves to measure water depth, called
acoustic sounding (fig. 4) Fig. 4
•
Sound pulse is transmitted
•
From transducer passing water
•
Medium to water bottom,
•
Reflected to transducer
•
Onboard ship and time lapse
•
Is recorded.
•
Water depth=(v x dt)/2
•
V = sound pulse speed in water
•
dt= time interval recorded
•
by transducer
E
c
h
o
s
o
u
n
d
i
n
g
p
r
o
c
e
s
s
•
Fig. 5 shows the process of echo sounding
•
•
Fig. 5
E
c
h
o
s
o
u
n
d
i
n
g
P
r
o
c
e
s
s
Fig. 6 is further illustration to acoustic sounding
operation.
Fig. 6.
S
o
u
n
d
s
p
e
e
d
i
n
w
a
t
e
r
Accuracy of measured water depth depends mainly on
accuracy of sound speed in water.
The
speed
of sound depends on the
temperature
of the
water, its
salinity
, and the
pressure
(which is equivalent
to
depth
below the sea surface).
The speed of sound ranges between
1400 and 1570
m/sec
. This is about 4 times faster than sound speed
through air.
C
o
r
r
e
c
t
i
o
n
f
o
r
s
o
u
n
d
s
p
e
e
d
i
n
w
a
t
e
r
Empirical formula were developed to compute correct speed due to
effects of water temp, salinity and depth:
Mackenzie Formula (1981):
c(D,S,T) =
1448.96 + 4.591T - 5.304 x 10
-2
T
2
+ 2.374 x 10
-4
T
3
+
1.340 (S-35) + 1.630 x 10
-2
D + 1.675 x 10
-7
D
2
- 1.025 x 10
-2
T(S - 35) –
7.139 x 10
-13
TD
3
Where, T = temperature in degrees Celsius
S = salinity in parts per thousand
D = depth in meters
Range of validity: temperature 2 to 30 °C, salinity 25 to 40 parts per
thousand, depth 0 to 8000 m.
For a depth up to 70m the above formula can be written simply as
(ignoring depth effect):
c(S,T) = 1448.96 + 4.591T - 5.304 x 10
-2
T
2
+ 2.374 x 10
-4
T
3
+ 1.340
(S-35) m/s
M
u
l
t
i
b
e
a
m
s
o
u
n
d
e
r
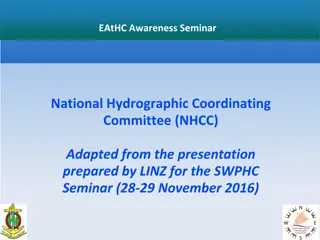
Echo sounder is further developed to multi beam sounder
(Fig. 7), scanning across sounding line:
Fig. 7
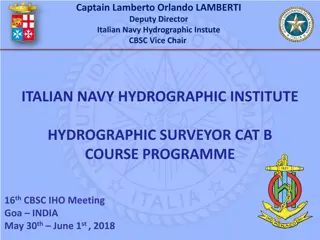
LIDAR Bathymetry
Light Detection and Ranging (LIDAR) sends two signals of different
wave lengths: green and red (Fig. 8)
Green laser pulses (532 nm) reflected
from bottom, Near-IR (1064 nm)
laser pulses reflected from water
surface. Difference in arrival time
allows depth measurement.
Fig. 8
P
o
s
i
t
i
o
n
i
n
g
S
o
u
n
d
i
n
g
S
t
a
t
i
o
n
s
1- Classical Survey techniques:
Fig. 9
-
Using Sextant (Fig. 9) to measure
angles to three ground control
stations and using resection
solution to locate ship position.
-
Using theodolite or total station at
two ground control points to ship
position and determine ship position
using intersection method
Positioning Sounding Stations
2-
GPS technique
A GPS can be taken onboard the ship to be used in Positioning
Sounding Stations at the time of measuring water depth.
What is even remarkable about the GPS system is its accuracy;
normally 10-15 meters for civilian systems, and a huge
improvement on the older sextant centered methods.
Another advantage of the system is that it is an
‘all weather’
one.
Even when one cannot see a landmark 50 meters away in dense
fog, the GPS will give you your position without any decrease in
accuracy.
GPS Positioning
Development of GPS
First developed for the US Department of Defense almost forty years ago, today this
global navigational satellite system uses between 24 and 32 satellites orbiting 11000
nautical miles in space, normally making two orbits around the earth every day.
Use on Board Ships
On board, the GPS receiver stores the almanac data for continuous use. It also
calculates, exactly how far the satellite is from the ship at any given instant.
Three such satellites and the calculations give us an exact
2D fix
on board- Latitude
and Longitude.
If there are four satellites used, one can calculate altitude as well.
By keeping a record of the ship’s positions, another simpler calculation determines
the ship’s speed, and the course it has made in the time between positions.
Almost all ships today carry a GPS receiver – sometimes more than one.
C
l
a
s
s
P
r
o
b
l
e
m
(
1
)
A
c
o
u
s
t
i
c
S
o
u
n
d
i
n
g
Compute the corrected sound signal
speed
in water and
water depth
if
water temp, T =
10
o
C ±1
o
C
; Salinity,
S = 37 ppt ±1ppt
; two way time
interval recorded on echo-sounder is
0.5 sec
.
Use the following empirical sound speed in water:
V(S,T)
=1449.2 +4.6
T
− 0.055
T
2
+(1.34 − 0.010
T
)(
S
− 35) m/sec
Compute
accuracy
of determined depth, using law of propagation of
errors:
Standard error = var(
f)]
1/2
= [(
∂
f/
∂
x)
2
var
(x) + (
∂
f/
∂
y)
2
var
(y)]
1/2
.
Set f = V (signal speed); x = T; y = S
C
l
a
s
s
P
r
o
b
l
e
m
(
2
)
S
o
u
n
d
i
n
g
S
t
a
t
i
o
n
P
o
s
i
t
i
o
n
i
n
g
Three ground control points A, B and C were observed from a ship (P) while
sounding is being carried out. Coordinates of control points and horizontal
angles observed using a sextant are given below.
Compute ship position.
Coordinates of control points:
Observed angles:
BPC = 57° 36'
BPA = 40° 08'
B C
A
Hint
: Solve triangle ABC
(Sides AB, BC, AC, angle ABC)
SEA
Form angle equation: PABCP
Form side equation using PB
Solve the two equations, apply
Ship, P
intersection formula
Hydrographic surveying is a specialized field within geomatics engineering focused on mapping the water floor to produce nautical charts or bathymetric maps. These surveys play a crucial role in navigation, pipeline routing, cable installation, and more, providing essential data for various applications such as flood control and pollution management. Learn about underwater topography, tidal datum, and classical methods used in hydrographic surveys.

Download Presentation

Please find below an Image/Link to download the presentation.
The content on the website is provided AS IS for your information and personal use only. It may not be sold, licensed, or shared on other websites without obtaining consent from the author.If you encounter any issues during the download, it is possible that the publisher has removed the file from their server.
You are allowed to download the files provided on this website for personal or commercial use, subject to the condition that they are used lawfully. All files are the property of their respective owners.
The content on the website is provided AS IS for your information and personal use only. It may not be sold, licensed, or shared on other websites without obtaining consent from the author.
E N D
Presentation Transcript
Introduction to Geomatics Engineering Introduction to Geomatics Engineering SE 312 SE 312 Hydrographic Survey Prof. Ismat Elhassan
Introduction: Mapping the water floor is a specialized field of surveying, called hydrographic surveying. The maps that hydrographic surveyors produce are called nautical charts or bathymetric maps. These, in fact, are topographic maps of the water bed. Hydrographic surveys include all underwater surveys encompassing all navigational, pipeline routing and sub marine cable installation and dredging surveys. It also provides data for flood control and water pollution control. However, typical hydrographic surveys are carried out for the purpose of navigation.
Underwater Topography Introduction To produce a contoured bathymetric map of the sea bed, known as (Nautical Chart) in three dimensions is a hydrographic surveying operation which can be divided into two main phases in general: Horizontal positioning of sounding stations (X and Y co- ordinates); and Sounding (water depth, Z co-ordinate) determination.
Introduction Tidal Datum To produce a contour map of the waterbed the third dimension should be determined by sounding to some datum level. The surface of the water from which the sounding is measured cannot be used as a datum due to the continuous fluctuations of the water level caused by tidal effects. An arbitrary datum is chosen, normally the lowest water level and each sounding reduced by the height of the tide above the selected datum level to give a reduced sounding defined as water depth from bottom to datum. In general, a datum is a base elevation used as a reference from which to reckon heights or depths. A tidal datum is a standard elevation defined by a certain phase of the tide. Tidal datum is used as reference to measure local water levels.
Classical Methods: In early days Hydrographic Surveys involve the depth measurement by sounding pole (Fig. 1) and hand lead line (Fig 2). The reading of these survey methods are analogue in nature, and it is a labor-intensive and time-consuming process. Thus, this method was not that popular. Fig. 1 Sounding Pole
Fig. 2 Fig. 2a Lead Line Fig. 2b Lead Line in operation
Lead line is further developed to sounding machine (Fig. 3) Fig, 3 Sounding Machine
Further development lead to using sounding waves to measure water depth, called acoustic sounding (fig. 4) Fig. 4 Sound pulse is transmitted From transducer passing water Medium to water bottom, Reflected to transducer Onboard ship and time lapse Is recorded. Water depth=(v x dt)/2 V = sound pulse speed in water dt= time interval recorded by transducer
Echo sounding Process Echo sounding Process Fig. 6 is further illustration to acoustic sounding operation. Fig. 6.
Sound speed in water Sound speed in water Accuracy of measured water depth depends mainly on accuracy of sound speed in water. The speed of sound depends on the temperature of the water, its salinity, and the pressure (which is equivalent to depth below the sea surface). The speed of sound ranges between 1400 and 1570 m/sec. This is about 4 times faster than sound speed through air.
Empirical formula were developed to compute correct speed due to effects of water temp, salinity and depth: Mackenzie Formula (1981): c(D,S,T) = 1448.96 + 4.591T - 5.304 x 10⁻²T2+ 2.374 x 10⁻⁴T3+ 1.340 (S-35) + 1.630 x 10⁻²D + 1.675 x 10⁻⁷D2- 1.025 x 10⁻²T(S - 35) 7.139 x 10⁻¹³TD3 Where, T = temperature in degrees Celsius S = salinity in parts per thousand D = depth in meters Range of validity: temperature 2 to 30 C, salinity 25 to 40 parts per thousand, depth 0 to 8000 m. For a depth up to 70m the above formula can be written simply as (ignoring depth effect): c(S,T) = 1448.96 + 4.591T - 5.304 x 10⁻²T2+ 2.374 x 10⁻⁴T3+ 1.340 (S-35) m/s
Echo sounder is further developed to multi beam sounder (Fig. 7), scanning across sounding line: Fig. 7
Light Detection and Ranging (LIDAR) sends two signals of different wave lengths: green and red (Fig. 8) Green laser pulses (532 nm) reflected from bottom, Near-IR (1064 nm) laser pulses reflected from water surface. Difference in arrival time allows depth measurement. Fig. 8
Classical Survey techniques: Fig. 9 - Using Sextant (Fig. 9) to measure angles to three ground control stations and using resection solution to locate ship position. - two ground control points to ship position and determine ship position using intersection method Using theodolite or total station at
2- GPS technique A GPS can be taken onboard the ship to be used in Positioning Sounding Stations at the time of measuring water depth. What is even remarkable about the GPS system is its accuracy; normally 10-15 meters for civilian systems, and a huge improvement on the older sextant centered methods. Another advantage of the system is that it is an all weather one. Even when one cannot see a landmark 50 meters away in dense fog, the GPS will give you your position without any decrease in accuracy.
First developed for the US Department of Defense almost forty years ago, today this global navigational satellite system uses between 24 and 32 satellites orbiting 11000 nautical miles in space, normally making two orbits around the earth every day. Use on Board Ships On board, the GPS receiver stores the almanac data for continuous use. It also calculates, exactly how far the satellite is from the ship at any given instant. Three such satellites and the calculations give us an exact 2D fix on board- Latitude and Longitude. If there are four satellites used, one can calculate altitude as well. By keeping a record of the ship s positions, another simpler calculation determines the ship s speed, and the course it has made in the time between positions. Almost all ships today carry a GPS receiver sometimes more than one.
Class Problem (1) Class Problem (1) Acoustic Sounding Acoustic Sounding Compute the corrected sound signal speed in water and water depth if water temp, T = 10oC 1oC; Salinity, S = 37 ppt 1ppt interval recorded on echo-sounder is 0.5 sec. ; two way time Use the following empirical sound speed in water: V(S,T) =1449.2 +4.6T 0.055T2+(1.34 0.010T)(S 35) m/sec Compute accuracy of determined depth, using law of propagation of errors: Standard error = var(f)]1/2= [( f/ x)2var(x) + ( f/ y)2var(y)]1/2. Set f = V (signal speed); x = T; y = S
Class Problem (2) Class Problem (2) Sounding Station Positioning Sounding Station Positioning Three ground control points A, B and C were observed from a ship (P) while sounding is being carried out. Coordinates of control points and horizontal angles observed using a sextant are given below. Compute ship position. Coordinates of control points: Observed angles: BPC = 57 36' BPA = 40 08' B C A Hint: Solve triangle ABC (Sides AB, BC, AC, angle ABC) SEA Form angle equation: PABCP Form side equation using PB Solve the two equations, apply Ship, P intersection formula


 sends two signals of")


")
")