How to be confident in your regression results
Delve into strategies for gaining confidence in regression results, explore weird regression tricks, and understand the social scientific process. Learn about question design, data estimation, and inference methods. Discover various design types, translation of concepts into mathematical models, data matching techniques, and the importance of estimation and robustness. Dive into testing assumptions, checking for outliers, and comparing regression approaches for robust analysis.

Download Presentation

Please find below an Image/Link to download the presentation.
The content on the website is provided AS IS for your information and personal use only. It may not be sold, licensed, or shared on other websites without obtaining consent from the author.If you encounter any issues during the download, it is possible that the publisher has removed the file from their server.
You are allowed to download the files provided on this website for personal or commercial use, subject to the condition that they are used lawfully. All files are the property of their respective owners.
The content on the website is provided AS IS for your information and personal use only. It may not be sold, licensed, or shared on other websites without obtaining consent from the author.
E N D
Presentation Transcript
How to be confident in your regression results Brigham R. Frandsen Family Studies Center Methods Workshop November 6, 2015
5 Weird Regression Tricks Editors Don t Want You to Know About Brigham R. Frandsen Family Studies Center Methods Workshop November 6, 2015
The Social Scientific Process Question Design/Model Data Estimation Inference
Question Design/Model Data Estimation Inference 6-Million Dollar Question How does educational attainment affect a fertility? Causal How do cohabitation rates vary by demographic and SES characteristics? Descriptive
Question Design/Model Data Estimation Inference Design Causal 1. Experimenter-controlled randomized experiment 2. Natural experiment 3. Differences-in-differences 4. Selection-on-observables Descriptive What is the population of interest? Does the relationship of interest live at the individual (micro) level, or aggregate (macro) level?
Question Design/Model Data Estimation Inference Model Translate your English to math Start simple ??= ?0+ ?1?1?+ ?2?2?+ + ??
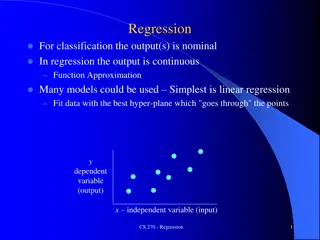
Question Design/Model Data Estimation Inference Data Match data to design Look at your data Histograms 0.5 0.4 0.3 0.2 0.1 0 -3 -2 -1 0 1 2 3 Scatter plots y 10 5 Summary statistics Tabulations Find the bugaboos Censoring Sample selection Missing data Clustered sampling 0 0 0.5 1 1.5
Question Design/Model Data Estimation Inference Estimation Trade efficiency for robustness Understand assumptions and consequences Example: omitted variables bias ??= ???+ ?? ? = ? + ????(??,??)/???(??) Test what s falsifiable Check robustness to modeling and data choices Probe sensitivity to outliers Compare median regression to mean regression Look at residual histogram
Question Design/Model Data Estimation Inference Inference Don t trust what Stata or R spits out by default Rules of thumb for variance formula: Cross-sectional data, micro variation: use the Huber-Eicker-White heteroscedasticity-robust formula Cross-sectional data, aggregate variation: use the cluster variance formula Panel (longitudinal) data: cluster at the individual level Time series data: Newey-West variance formula Quit star-gazing!
Question Design/Model Data Estimation Inference Wrap up 1. Ask a coherent question! 2. Make sure design is equipped to answer it! 3. Match data to design! 4. Choose transparency and robustness over efficiency and sophistication! 5. Be skeptical of defaults and don t star gaze!