Horizontal Boundaries of Firms in Economics

ECO 610: Lecture 4
Horizontal Boundaries of the
Firm
Horizontal Boundaries of the Firm: Outline
•
Long-run average cost (LRAC) curve
•
Shape of the LRAC: economies and diseconomies of scale
•
Optimal plant size: minimum efficient scale (MES)
•
MES, market demand, and market structure
•
Horizontal boundaries vs. vertical boundaries
•
Reasons why economies of scale might occur
Product-level economies
Plant-level economies
Firm-level economies
•
Economies of scope
The LRAC curve and economies of scale
•
Given sufficient time to plan and execute, firms can vary all inputs
optimally for whatever scale of operation they desire.
•
So in reality, firms can choose from many different plant sizes. The
LRAC curve is the envelope of all the SRATC curves associated with
each different plant size.
•
The LRAC curve tells us the minimum possible average total cost for
producing each output level.
•
The shape of the LRAC curve tells us how per unit costs change as the
firm changes the scale of its operations.
Economies and diseconomies of scale
•
If per unit costs fall as the firm increases the scale of its operations,
the LRAC curve will be downward sloping. We say that the firm
experiences
economies of scale
.
•
If per unit costs do not change as the firm increases the scale of its
operations, the LRAC curve will be flat. We say that the firm
experiences
constant returns to scale
.
•
If per unit costs rise as the firm increases the scale of its operations,
the LRAC curve will be upward sloping. We say that the firm
experiences
diseconomies of scale
.
Minimum Efficient Scale (MES)
•
How big does the firm have to be in order to produce the product as
cheaply as possible?
•
We call the scale of operations (Q) at which the LRAC curve reaches
its minimum level of cost the
Minimum Efficient Scale
, or MES.
•
Firms operating at a smaller scale could lower their per unit costs by
increasing their scale. Firms operating at a sub-optimal scale will be
at a competitive disadvantage relative to firms that have attained
MES.
•
Compare the per unit costs of firms operating at a scale of 50k, 100k,
and 150k output per period. Cost disadvantage?
MES and market structure
•
How many fast-food restaurants are there in Lexington? In Lawrenceburg?
Why?
https://www.yellowpages.com/search?search_terms=Fast+Food+Restaura
nts&geo_location_terms=lawrenceburg+ky
•
The relationship between minimum efficient scale of production and
market demand explains a lot of what we observe about market structure.
•
If MES is large relative to market demand, there is limited room in the
market for efficient-sized producers. In the limit we have natural
monopoly—a market that will support only one MES firm, e.g. Floyd, VA
https://www.yellowpages.com/search?search_terms=Fast+Food+Restaura
nts&geo_location_terms=floyd+va
•
If MES is small relative to market demand, there is room for many efficient-
sized producers.
Horizontal vs. Vertical Boundaries of the Firm
•
Vertical boundaries have to do with the vertical chain of production:
the relevant question is how vertically integrated will an efficient
producer be? For example, in the aluminum industry, should a
primary aluminum smelting company be vertically integrated
upstream into alumina refining and bauxite mining? Should it be
vertically integrated downstream into rolling, casting, and extruding
and then into finished aluminum products?
•
Horizontal boundaries have to do with how big (scale of operations)
does a firm producing at any given stage in the vertical chain, e.g.
aluminum smelting, need to be to attain MES? A related question is
whether the firm should produce a single product or a set of related
products.
Vertical Boundaries: The Vertical Chain of Aluminum Production
Bauxite ore
Alumina
Molten aluminum
Ingots
Final goods (examples)
Transportation, Building and Construction, Machinery, Containers and
Packing, Etc.
Refining
Smelting
Casting / Alloying
Initial fabrication
Further fabrication
Recycling
Horizontal Boundaries: Economies of Scale in
Aluminum Smelting
Reasons why economies of scale may occur
•
Aspects of economies of scale:
•
Product-level economies
Fixed set-up costs
Specialization of inputs
Learning by doing
•
Plant-level economies
Engineering relationships
Economies of massed reserves (inventories)
“Meshing” or indivisibilities
•
Firm-level economies
Multi-plant operations
Economies in input procurement
Economies in sales promotion
Product-level economies: fixed setup costs
•
Setup costs: for many production processes there are setup costs
that do not vary with the length of the production run.
•
Example:
https://www.youtube.com/watch?v=mTtbXot3lik
•
Fixed setup costs are obviously smaller on a per unit basis the longer
the production run.
•
Tradeoff: inventory holding costs vs. per unit production costs—a
problem for us to solve in operations management.
Product-level economies: specialization of
inputs
•
With greater output, it makes sense to break down the production
process into smaller and smaller steps and to specialize tasks among
inputs.
•
This applies to both human inputs (labor) and machinery and
equipment (capital).
•
https://www.youtube.com/watch?v=PKG_TObuyNk
•
https://www.youtube.com/watch?v=hWhPaZjd2CA
•
MBA degree: general human capital or specific human capital?
Product-level economies: learning by doing
•
When intricate labor operations must be performed or when complex
adjustments must worked out by trial and error, per unit costs fall as
the cumulative volume of production increases and workers learn by
doing.
•
This phenomenon is known as the
Learning Curve
.
•
Would you as an airline passenger like to be part of the learning
process that Boeing workers go through?
http://search.proquest.com.ezproxy.uky.edu/docview/1558679198/E
F4B7FDC62864519PQ/72?accountid=11836
.
•
Is there a similar learning curve phenomenon associated with Toyota’s
introduction of a new model of the Camry?
Plant-level economies: engineering
relationships
•
The output of a processing unit tends within certain physical limits to
be roughly proportional to the volume of the unit, while the amount
of materials and fabrication effort required to construct the unit is
more closely proportional to the surface area of the unit’s reaction
chambers, storage tanks, connecting pipes, etc.
•
Rule of two-thirds: the area of a sphere or cylinder varies as the two-
thirds power of volume.
•
What does it all mean, if all you want to do is brew some beer?
Plant-level economies: economies of massed
reserves (inventories)
•
Machines sometimes break down. Employees sometimes don’t show up
for work. Input suppliers sometimes don’t deliver. What to do? Shut
down? Hold inventories?
•
Risk Management: how do the reserves (machines, workers, inputs) that
you must hold to attain a certain level of reliability vary with the scale of
your operations?
•
Probability of a robot welding machine breaking down (or a line worker not
showing up) is 5%, i.e. one day out of twenty. If you have one robot welder
in your production line, how many robot welders do you need to hold in
reserve in order to reduce the probability of a factory shutdown to 1%?
Suppose you scale up by a factor of ten, and have ten robot welders? How
many do you need to hold in reserve now?
Plant-level economies: “Meshing” or
indivisibilities
•
Many inputs come in lumpy units, with different rates of through-put.
•
How well inputs at different stages of the production process with
different through-put rates “mesh” with one another gets better as
the scale of operations increases.
•
Example: hydraulic stamping machine can process 15 parts per hour.
Robot welding machine can process 10 parts per hour. If the desired
rate of output is 10 parts per hour, how many of each machine do we
need? If desired rate of output is 15 parts per hour? 20 parts per
hour? 30 parts per hour?
https://www.tourtoyota.com/kentucky
Firm-level economies: multi-plant operations
•
Suppose the firm serves a market of non-zero geographic expanse,
and the costs of delivering output to customers (or bringing
customers to the place where service is provided) are non-trivial.
•
If it must reach out to more distant customers in order to increase
output, then the firm faces a tradeoff between transportation costs,
which increase with distance, and per-unit production costs, which
may vary with scale of production.
•
If shipping costs are low (high value-to-weight ratio) and economies
of scale are significant, what configuration of plants is optimal?
•
If shipping costs are high (low value-to-weight ratio) and economies
of scale are not significant, what configuration of plants is optimal?
Multi-plant operations: ABInbev vs. P&G
•
A market of considerable geographic expanse is served and outbound
transportation costs are appreciable:
https://en.wikipedia.org/wiki/Anheuser-Busch#Brewery_operations
•
Shipping costs are low relative to the value of the product, but the
firm has complex product lines:
http://www.pglocations.com/
http://www.pglocations.com/cape-girardeau/welcome
http://www.bizjournals.com/cincinnati/news/2015/02/10/p-g-to-build-500m-
manufacturing-plant.html
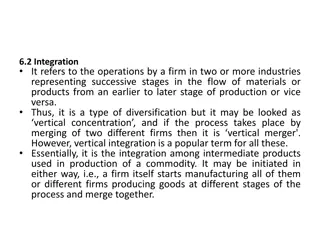
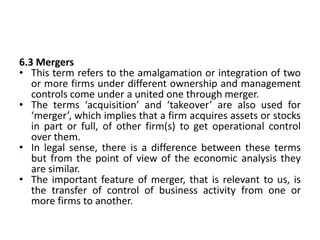
Economies of Scope: multi-product firms
•
Sometimes there are shared inputs or other reasons that make it cheaper
to produce two products together rather than produce each separately.
When that is the case, we say that there are
Economies of Scope
across
the production of the two products.
•
Economies of scope exist if C(X, Y) < C(X, 0) + C(0, Y) .
•
Examples? Dairy processing plant, with fluid milk, cottage cheese, and ice
cream? Alligators and chickens?
http://www.nytimes.com/2000/06/18/us/camilla-journal-new-role-for-
the-gator-chicken-farmer-s-friend.html?pagewanted=all&src=pm
•
Implications for mergers and divestitures?
http://www.convergencealimentaire.info/map.jpg
http://ezproxy.uky.edu/login?url=http://search.proquest.com/docview/90
8477763/13873A4DA7C70384EF8/83?accountid=11836
Required Outside readings
:
“Power Pork: Corporations Begin to Turn Hog Business into an Assembly Line,”
WSJ,
3/28/94.
http://ezproxy.uky.edu/login?url=http://search.proquest.com/docview/398373847?accountid=11836
.
“Meet the World’s Largest Cargo Ships,”
WSJ
, 1/8/13.
http://search.proquest.com.ezproxy.uky.edu/docview/1266990140/A537F218D2EE4AFCPQ/71?accoun
tid=11836
“New Role for the Gator: Chicken Farmer’s Friend,”
New York Times
, 6/18/2000.
http://www.nytimes.com/2000/06/18/us/camilla-journal-new-role-for-the-gator-chicken-farmer-s-
friend.html?pagewanted=all&src=pm
Exploring the concept of horizontal boundaries in firm behavior, this lecture delves into Long-run Average Cost curve, economies and diseconomies of scale, optimal plant size, and the Minimum Efficient Scale. It discusses how economies of scale affect production costs and the relationship between market demand and the firm's efficient scale of production. Essential for understanding market structures and firm competitiveness.

Download Presentation

Please find below an Image/Link to download the presentation.
The content on the website is provided AS IS for your information and personal use only. It may not be sold, licensed, or shared on other websites without obtaining consent from the author.If you encounter any issues during the download, it is possible that the publisher has removed the file from their server.
You are allowed to download the files provided on this website for personal or commercial use, subject to the condition that they are used lawfully. All files are the property of their respective owners.
The content on the website is provided AS IS for your information and personal use only. It may not be sold, licensed, or shared on other websites without obtaining consent from the author.
E N D
Presentation Transcript
ECO 610: Lecture 4 Horizontal Boundaries of the Firm
Horizontal Boundaries of the Firm: Outline Long-run average cost (LRAC) curve Shape of the LRAC: economies and diseconomies of scale Optimal plant size: minimum efficient scale (MES) MES, market demand, and market structure Horizontal boundaries vs. vertical boundaries Reasons why economies of scale might occur Product-level economies Plant-level economies Firm-level economies Economies of scope
The LRAC curve and economies of scale Given sufficient time to plan and execute, firms can vary all inputs optimally for whatever scale of operation they desire. So in reality, firms can choose from many different plant sizes. The LRAC curve is the envelope of all the SRATC curves associated with each different plant size. The LRAC curve tells us the minimum possible average total cost for producing each output level. The shape of the LRAC curve tells us how per unit costs change as the firm changes the scale of its operations.
Economies and diseconomies of scale If per unit costs fall as the firm increases the scale of its operations, the LRAC curve will be downward sloping. We say that the firm experiences economies of scale. If per unit costs do not change as the firm increases the scale of its operations, the LRAC curve will be flat. We say that the firm experiences constant returns to scale. If per unit costs rise as the firm increases the scale of its operations, the LRAC curve will be upward sloping. We say that the firm experiences diseconomies of scale.
Minimum Efficient Scale (MES) How big does the firm have to be in order to produce the product as cheaply as possible? We call the scale of operations (Q) at which the LRAC curve reaches its minimum level of cost the Minimum Efficient Scale, or MES. Firms operating at a smaller scale could lower their per unit costs by increasing their scale. Firms operating at a sub-optimal scale will be at a competitive disadvantage relative to firms that have attained MES. Compare the per unit costs of firms operating at a scale of 50k, 100k, and 150k output per period. Cost disadvantage?
MES and market structure How many fast-food restaurants are there in Lexington? In Lawrenceburg? Why? https://www.yellowpages.com/search?search_terms=Fast+Food+Restaura nts&geo_location_terms=lawrenceburg+ky The relationship between minimum efficient scale of production and market demand explains a lot of what we observe about market structure. If MES is large relative to market demand, there is limited room in the market for efficient-sized producers. In the limit we have natural monopoly a market that will support only one MES firm, e.g. Floyd, VA https://www.yellowpages.com/search?search_terms=Fast+Food+Restaura nts&geo_location_terms=floyd+va If MES is small relative to market demand, there is room for many efficient- sized producers.
Horizontal vs. Vertical Boundaries of the Firm Vertical boundaries have to do with the vertical chain of production: the relevant question is how vertically integrated will an efficient producer be? For example, in the aluminum industry, should a primary aluminum smelting company be vertically integrated upstream into alumina refining and bauxite mining? Should it be vertically integrated downstream into rolling, casting, and extruding and then into finished aluminum products? Horizontal boundaries have to do with how big (scale of operations) does a firm producing at any given stage in the vertical chain, e.g. aluminum smelting, need to be to attain MES? A related question is whether the firm should produce a single product or a set of related products.
Vertical Boundaries: The Vertical Chain of Aluminum Production Bauxite ore Refining Alumina Smelting Recycling Molten aluminum Casting / Alloying Ingots Initial fabrication Sheet Wire Bar Plate Foil Rod Further fabrication Final goods (examples) Transportation, Building and Construction, Machinery, Containers and Packing, Etc.
Horizontal Boundaries: Economies of Scale in Aluminum Smelting
Reasons why economies of scale may occur Aspects of economies of scale: Product-level economies Fixed set-up costs Specialization of inputs Learning by doing Plant-level economies Engineering relationships Economies of massed reserves (inventories) Meshing or indivisibilities Firm-level economies Multi-plant operations Economies in input procurement Economies in sales promotion
Product-level economies: fixed setup costs Setup costs: for many production processes there are setup costs that do not vary with the length of the production run. Example: https://www.youtube.com/watch?v=mTtbXot3lik Fixed setup costs are obviously smaller on a per unit basis the longer the production run. Tradeoff: inventory holding costs vs. per unit production costs a problem for us to solve in operations management.
Product-level economies: specialization of inputs With greater output, it makes sense to break down the production process into smaller and smaller steps and to specialize tasks among inputs. This applies to both human inputs (labor) and machinery and equipment (capital). https://www.youtube.com/watch?v=PKG_TObuyNk https://www.youtube.com/watch?v=hWhPaZjd2CA MBA degree: general human capital or specific human capital?
Product-level economies: learning by doing When intricate labor operations must be performed or when complex adjustments must worked out by trial and error, per unit costs fall as the cumulative volume of production increases and workers learn by doing. This phenomenon is known as the Learning Curve. Would you as an airline passenger like to be part of the learning process that Boeing workers go through? http://search.proquest.com.ezproxy.uky.edu/docview/1558679198/E F4B7FDC62864519PQ/72?accountid=11836 . Is there a similar learning curve phenomenon associated with Toyota s introduction of a new model of the Camry?
Plant-level economies: engineering relationships The output of a processing unit tends within certain physical limits to be roughly proportional to the volume of the unit, while the amount of materials and fabrication effort required to construct the unit is more closely proportional to the surface area of the unit s reaction chambers, storage tanks, connecting pipes, etc. Rule of two-thirds: the area of a sphere or cylinder varies as the two- thirds power of volume. What does it all mean, if all you want to do is brew some beer?
Plant-level economies: economies of massed reserves (inventories) Machines sometimes break down. Employees sometimes don t show up for work. Input suppliers sometimes don t deliver. What to do? Shut down? Hold inventories? Risk Management: how do the reserves (machines, workers, inputs) that you must hold to attain a certain level of reliability vary with the scale of your operations? Probability of a robot welding machine breaking down (or a line worker not showing up) is 5%, i.e. one day out of twenty. If you have one robot welder in your production line, how many robot welders do you need to hold in reserve in order to reduce the probability of a factory shutdown to 1%? Suppose you scale up by a factor of ten, and have ten robot welders? How many do you need to hold in reserve now?
Plant-level economies: Meshing or indivisibilities Many inputs come in lumpy units, with different rates of through-put. How well inputs at different stages of the production process with different through-put rates mesh with one another gets better as the scale of operations increases. Example: hydraulic stamping machine can process 15 parts per hour. Robot welding machine can process 10 parts per hour. If the desired rate of output is 10 parts per hour, how many of each machine do we need? If desired rate of output is 15 parts per hour? 20 parts per hour? 30 parts per hour? https://www.tourtoyota.com/kentucky
Firm-level economies: multi-plant operations Suppose the firm serves a market of non-zero geographic expanse, and the costs of delivering output to customers (or bringing customers to the place where service is provided) are non-trivial. If it must reach out to more distant customers in order to increase output, then the firm faces a tradeoff between transportation costs, which increase with distance, and per-unit production costs, which may vary with scale of production. If shipping costs are low (high value-to-weight ratio) and economies of scale are significant, what configuration of plants is optimal? If shipping costs are high (low value-to-weight ratio) and economies of scale are not significant, what configuration of plants is optimal?
Multi-plant operations: ABInbev vs. P&G A market of considerable geographic expanse is served and outbound transportation costs are appreciable: https://en.wikipedia.org/wiki/Anheuser-Busch#Brewery_operations Shipping costs are low relative to the value of the product, but the firm has complex product lines: http://www.pglocations.com/ http://www.pglocations.com/cape-girardeau/welcome http://www.bizjournals.com/cincinnati/news/2015/02/10/p-g-to-build-500m- manufacturing-plant.html
Economies of Scope: multi-product firms Sometimes there are shared inputs or other reasons that make it cheaper to produce two products together rather than produce each separately. When that is the case, we say that there are Economies of Scope across the production of the two products. Economies of scope exist if C(X, Y) < C(X, 0) + C(0, Y) . Examples? Dairy processing plant, with fluid milk, cottage cheese, and ice cream? Alligators and chickens? http://www.nytimes.com/2000/06/18/us/camilla-journal-new-role-for- the-gator-chicken-farmer-s-friend.html?pagewanted=all&src=pm Implications for mergers and divestitures? http://www.convergencealimentaire.info/map.jpg http://ezproxy.uky.edu/login?url=http://search.proquest.com/docview/90 8477763/13873A4DA7C70384EF8/83?accountid=11836
Required Outside readings: Power Pork: Corporations Begin to Turn Hog Business into an Assembly Line, WSJ, 3/28/94. http://ezproxy.uky.edu/login?url=http://search.proquest.com/docview/398373847?accountid=11836. Meet the World s Largest Cargo Ships, WSJ, 1/8/13. http://search.proquest.com.ezproxy.uky.edu/docview/1266990140/A537F218D2EE4AFCPQ/71?accoun tid=11836 New Role for the Gator: Chicken Farmer s Friend, New York Times, 6/18/2000. http://www.nytimes.com/2000/06/18/us/camilla-journal-new-role-for-the-gator-chicken-farmer-s- friend.html?pagewanted=all&src=pm


")
")