HIP Enrollment by Race


*information developed based on 2013 ACS data, based upon 2012 income
**Actual HIP enrollment as of June 2015
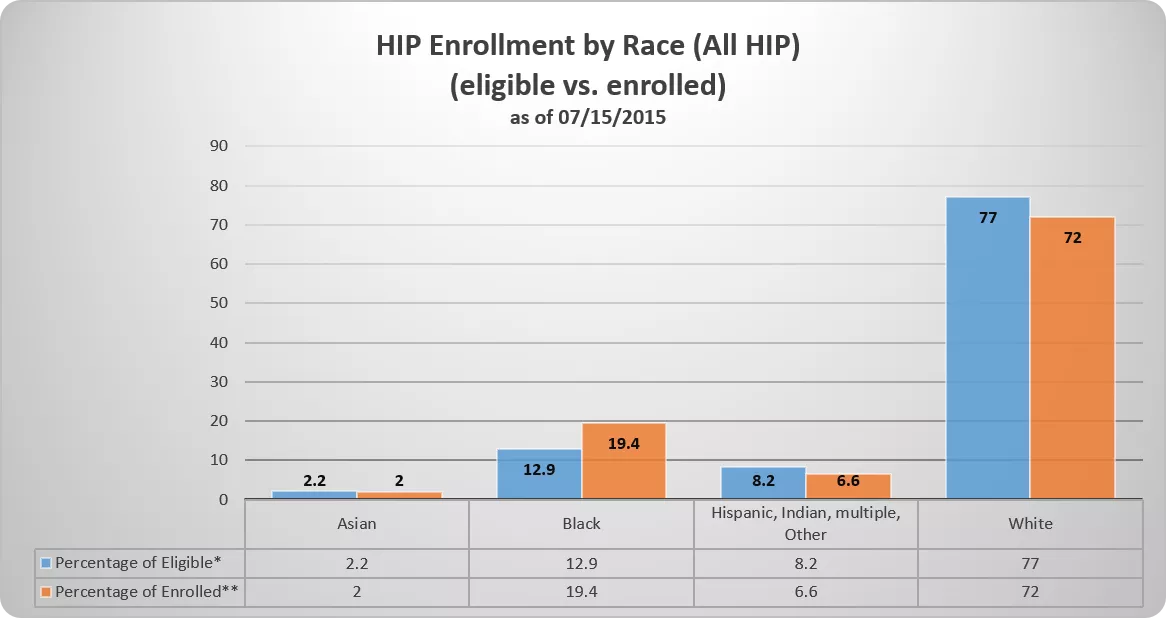
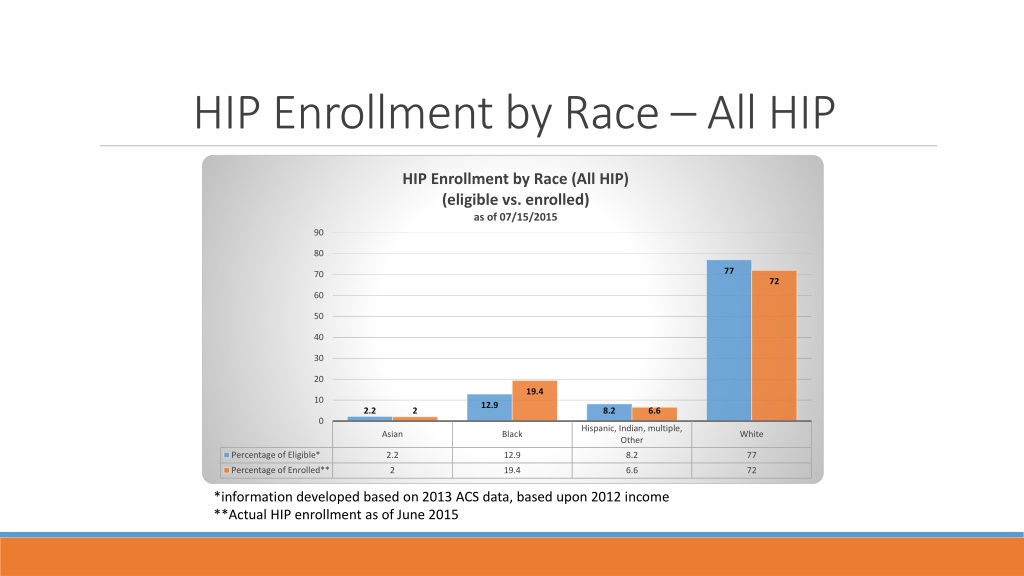
HIP Enrollment by Race – All HIP

*information developed based on 2013 ACS data, based upon 2012 income
**Actual HIP enrollment as of June 2015
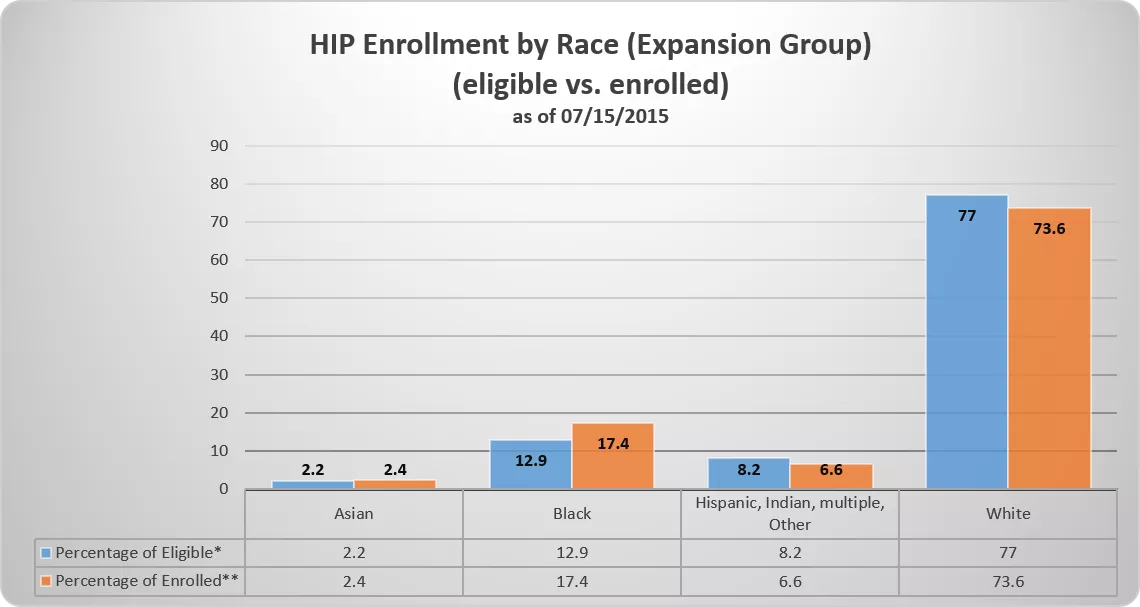
HIP Newly Eligible by Race
Medically Frail in HIP
Approximately 8% of HIP members are confirmed medically frail.
(25,464 medically frail members out of 300,574 total members)
Presumptive Eligibility Qualified Providers
Presumptive Eligibility
July 2015
14,016 PE Applications
10,993 PE Applications Approved
PE Experience in 1
st
Quarter of HIP
*Additional applications could have been approved after the date of this data pull.
Data on enrollment by race for HIP, including percentages of eligible and enrolled individuals, as well as information on newly eligible members and medically frail individuals. Additionally, details on presumptive eligibility qualified providers and applications are provided.

Download Presentation

Please find below an Image/Link to download the presentation.
The content on the website is provided AS IS for your information and personal use only. It may not be sold, licensed, or shared on other websites without obtaining consent from the author.If you encounter any issues during the download, it is possible that the publisher has removed the file from their server.
You are allowed to download the files provided on this website for personal or commercial use, subject to the condition that they are used lawfully. All files are the property of their respective owners.
The content on the website is provided AS IS for your information and personal use only. It may not be sold, licensed, or shared on other websites without obtaining consent from the author.
E N D
Presentation Transcript
HIP Enrollment by Race All HIP HIP Enrollment by Race (All HIP) (eligible vs. enrolled) as of 07/15/2015 90 80 77 70 72 60 50 40 30 20 19.4 10 12.9 2.2 2 8.2 6.6 0 Hispanic, Indian, multiple, Other Asian Black White Percentage of Eligible* 2.2 12.9 8.2 77 Percentage of Enrolled** 2 19.4 6.6 72 *information developed based on 2013 ACS data, based upon 2012 income **Actual HIP enrollment as of June 2015
HIP Newly Eligible by Race HIP Enrollment by Race (Expansion Group) (eligible vs. enrolled) as of 07/15/2015 90 80 77 70 73.6 60 50 40 30 20 17.4 10 12.9 2.2 2.4 8.2 6.6 0 Hispanic, Indian, multiple, Other Asian Black White Percentage of Eligible* 2.2 12.9 8.2 77 Percentage of Enrolled** 2.4 17.4 6.6 73.6 *information developed based on 2013 ACS data, based upon 2012 income **Actual HIP enrollment as of June 2015
Medically Frail in HIP Approximately 8% of HIP members are confirmed medically frail. (25,464 medically frail members out of 300,574 total members)
Presumptive Eligibility Qualified Providers QPs July 2015 Provider Type Total Potential Provider by Type* Number of Qualified Provider 114 Acute Care Hospital 219 Community Mental Health Center 23 25 Federally Qualified Health Center 27 68 Psychiatric Hospital 17 30 Rural Health Clinic 20 66 County Health Department 9 57 Total 210 465
Presumptive Eligibility July 2015 14,016 PE Applications 10,993 PE Applications Approved PE Category Number PE Approved HIP 9,313 Child 1-18 979 Pregnant Woman 296 Family Planning 194 Child less than 1 year old 146 Former Foster Care 24 Parent/Caretaker 41 Total 10,993
PE Experience in 1st Quarter of HIP Presumptive Eligibility Applications and Performance Feb 1, 2015-April 30, 2015 IHCP IHCP PE Applications Submitted PE applications Approved Provider Type Applications Submitted 18,492 Applications Approved* 11,413 Acute Care Hospital Community Mental Health Center Federally Qualified Health Center Psychiatric Hospital 26,788 20,455 299 231 221 124 1,100 899 854 430 176 136 132 90 Rural Health Clinic County Health Department Grand Total 6 0 3 0 3 0 2 0 28,369 21,724 19,702 12,059* *Additional applications could have been approved after the date of this data pull.