Hidden Markov Model and Markov Chain Patterns


Hidden
Markov Model
Lecture – 9
Department of CSE, DIU
1.
Markov Chain Model
- Markov Chain Model: Notation
2. Probability of a Sequence for a Given Markov
Chain Model
3.
CpG Island
4. Hidden Markov Model
- Forward Algorithm
- Viterbi Algorithm
CONTENTS
1.
Markov
Chain Model
Design of a Markov Chain Model
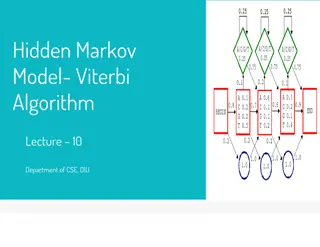
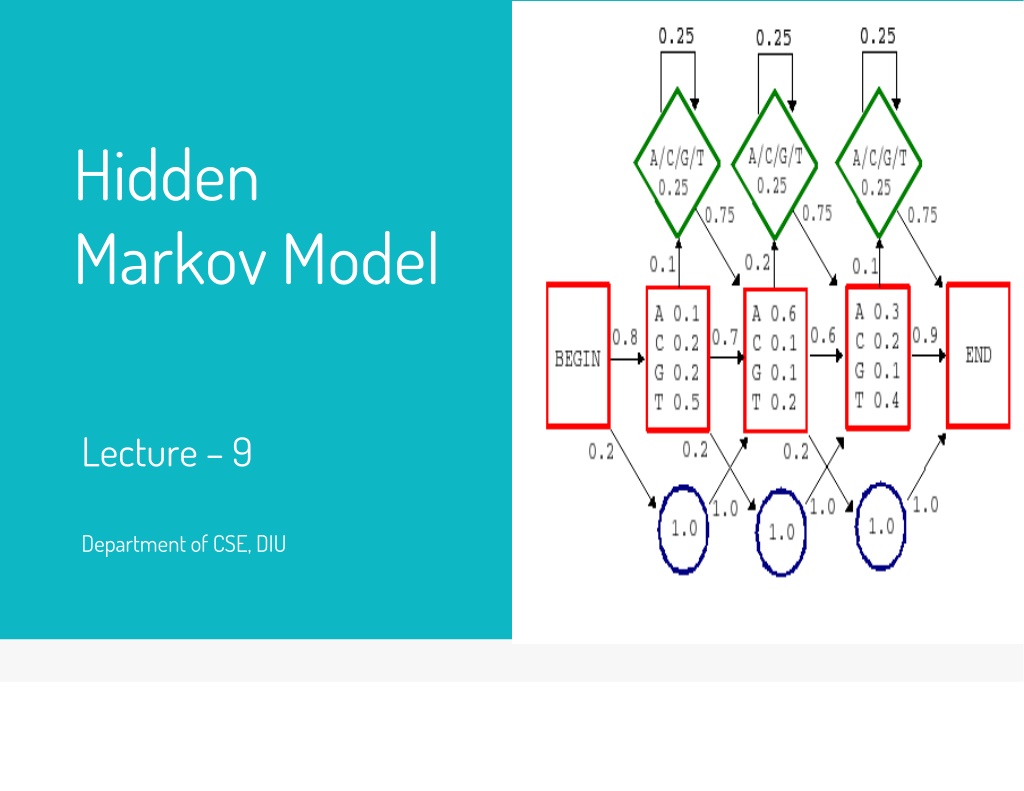
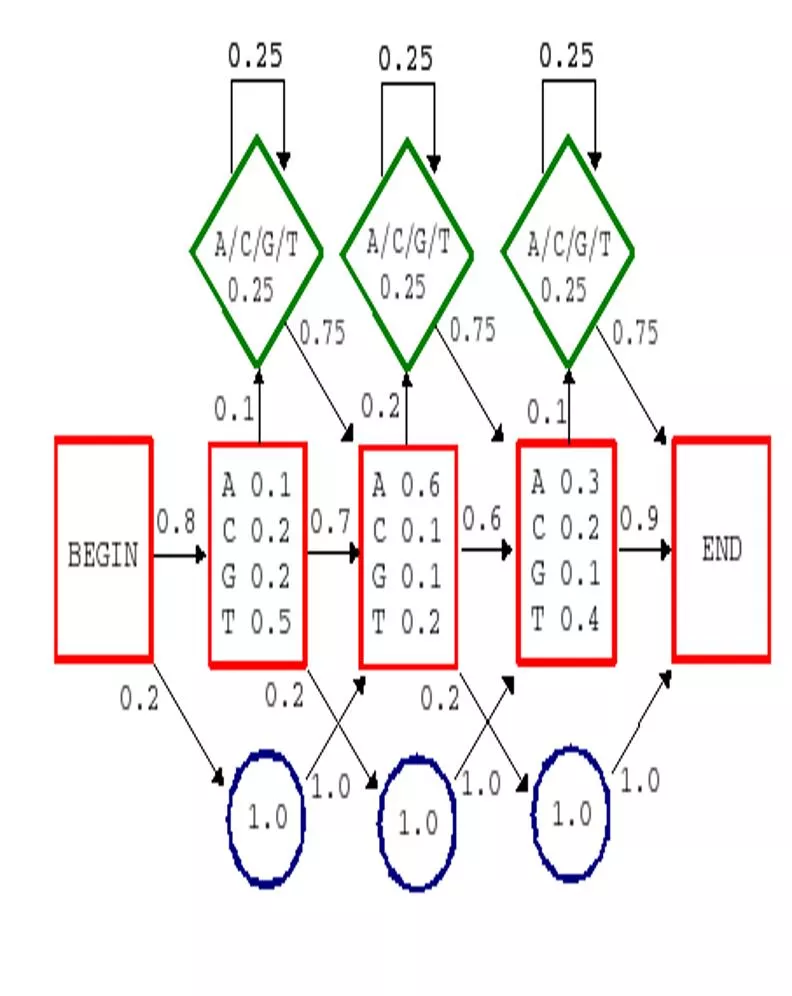
A Markov Chain Model is
defined by a set of states
(A,C,G,T) and a set of
transitions associated with
those states.
Markov Chain Model
•
Each and every transition from one site to
another (A to G, C to A etc.) will occur with
some transition probability (Will be given
in Question as a Chart)
•
There will be given a specific probability
value for each transition from ‘Begin’ to all
other sites (Begin to A, Begin to C etc.)
•
If no transition value is given for Begin,
then assign (1/4) = 0.25 to each of the
transitions (Begin -> A, Begin -> C, Begin -
> G, Begin -> T)
•
Same will be applicable for all transition
to End (not shown in this picture, but
shown in the previous slide’s picture)
Markov Chain Model
•
t
h
e
transition
parameter
s
ca
n
b
e
denote
d
b
y
a
where
•
similarly we can
denote the
probability
of
a
sequence
x
as
wher
e
a
represent
s
the
transition
from
the
begin
state
a
Pr
(
x
|
x
)
i
i
1
x
i
1
x
i
x
i
1
x
i
L
Pr
(
x
1
)
Pr
(
x
i
|
x
i
1
)
L
B
x
1
x
i
1
x
i
a
a
i
2
i
2
B
x
i
Markov Chain Model: Notation
2.
Probability of a Sequence for a
Given Markov Chain Model
Calculate the probability of a given sequence using Marcov Chain
Model
P(CGGT) = P(C | begin) P(G | C) P(G | G) P(T | G) P(end | T)
= 0.25 x 0.27 x 0.38 x 0.12 x 0.25
= 0.0007659
P (C|A)
Calculate the Probability of a given sequence
3. CpG Island
•
C
p
G
d
i
n
u
c
l
e
o
t
i
d
e
s
a
r
e
r
a
r
e
r
t
h
a
n
w
o
u
l
d
b
e
e
x
p
e
c
t
e
d
f
r
o
m
t
h
e
i
n
d
e
p
e
n
d
e
n
t
p
r
o
b
a
b
i
l
i
t
i
e
s
o
f
C
a
n
d
G
.
–
R
e
a
s
o
n
:
W
h
e
n
C
p
G
o
c
c
u
r
s
,
C
i
s
t
y
p
i
c
a
l
l
y
c
h
e
m
i
c
a
l
l
y
m
o
d
i
f
i
e
d
b
y
m
e
t
h
y
l
a
t
i
o
n
a
n
d
t
h
e
r
e
i
s
a
r
e
l
a
t
i
v
e
l
y
h
i
g
h
c
h
a
n
c
e
o
f
m
e
t
h
y
l
-
C
m
u
t
a
t
i
n
g
i
n
t
o
T
•
A
C
p
G
i
s
l
a
n
d
i
s
a
r
e
g
i
o
n
w
h
e
r
e
C
p
G
d
i
n
u
c
l
e
o
t
i
d
e
s
a
r
e
m
u
c
h
m
o
r
e
a
b
u
n
d
a
n
t
t
h
a
n
e
l
s
e
w
h
e
r
e
.
•
Hig
h
Cp
G
f
requenc
y
ma
y
b
e
biologicall
y
significant;
e.g.
,
ma
y
signa
l
promote
r
regio
n
(“start
”
o
f
a
gene).
Written
CpG
to
distinguis
h
from
a
C
≡
G
bas
e
pair
CpG Island
•
suppose
we
want to distinguish
CpG
islands
from
other
sequence
regions
•
given
sequences
fro
m
CpG
islands,
and
sequences
from
other
regions,
we
can
construct
–
a
model
to
represent
CpG
islands
(model
+)
–
a
null
model
to
represent
other
regions
(model
-)
•
can
then
score
a
test
sequence
by:
scor
e
(
x
)
log
Pr(
x
|
model
)
Pr
(
x
|
model
-
)
Markov Chain for Discrimination
•
parameters
estimated
for
+
and
-
models
–
human sequences
containing
48 CpG
islands
–
6
0,00
0 nucleotides
•
Calculated
Transition
probabilities
for
both
models
Markov Chain for Discrimination
•
Calculated
the
log-odds
ratio
•
are the log-likelihood
ratios
of
corresponding
transition
probabilities
L
i
1
L
i
1
a
x
i
1
x
i
x
i
1
x
i
i
1
i
scor
e
(
x
)
log
Pr
(
x
|
model
)
x
x
a
Pr
(
x
|
model
-
)
log
x
x
i
1
i
Markov Chain for Discrimination
4. Hidden
Markov
Model
•
Components:
–
O
bserved
variables
•
E
mitted
symbols
–
H
idden
variables
–
R
elationships
between
them
•
R
epresente
d
b
y
a
grap
h
wit
h transition
probabilities
•
G
o
a
l
:
F
i
n
d
t
h
e
m
o
s
t
l
i
k
e
l
y
e
x
p
l
a
n
a
t
i
o
n
f
o
r
t
h
e
o
b
s
e
r
v
e
d
v
a
r
i
a
b
l
e
s
Hidden Markov Model (HMM)
•
we’l
l
distinguis
h
betwee
n
th
e
observe
d
parts
o
f
a
proble
m
an
d
th
e
hidde
n
parts
•
i
n the
Marko
v
chai
n
model
s
i
t
i
s
clea
r
which
state
account
s
for
eac
h
par
t
o
f
the
observed
sequence
•
i
n
th
e
mode
l
above
,
ther
e
ar
e
multipl
e
states
tha
t
coul
d
accoun
t
fo
r
eac
h
par
t
o
f
the
observe
d
sequence
–
this is the
hidden part of the
problem
–
the essential
difference
between
Markov
chain and Hidden
Markov model
Why Hidden?
•
States are decoupled
from
symbols
•
x
is
the
sequence
of
symbols
emitted
by
model
–
x
i
i
s
the
symbo
l
emitte
d
a
t
time
i
•
A
p
a
t
h
,
,
i
s
a
s
e
q
u
e
n
c
e
o
f
s
t
a
t
e
s
–
T
he
i
-
th
state
i
n
i
s
i
•
a
kr
is
the
probability
of
making
a
transition
from
state
k
t
o
state
r
:
a
kr
Pr
(
i
r
|
i
1
k
)
•
e
k
(b)
is
the
probability
that
symbol
b
is
emitted
when
in
state
k
e
k
(
b
)
Pr(
x
i
b
|
i
k
)
Hidden Markov Model: Notations
•
A
casino uses
a
fair
die
most
of
the
time,
but
occasionally
switches
to
a
loaded
one
–
F
ai
r
die
:
Prob(1
)
=
Prob(2
)
=
.
.
.
=
Prob(6
)
=
1/6
–
Loade
d
die
:
Prob(1
)
=
Prob(2
)
=
.
.
.
=
Prob(5
)
=
1/10,
Prob(6)
=
½
–
T
h
e
s
e
a
r
e
t
h
e
e
m
i
s
s
i
o
n
p
r
o
b
a
b
i
l
i
t
i
e
s
•
T
r
a
n
s
i
t
i
o
n
p
r
o
b
a
b
i
l
i
t
i
e
s
–
P
r
o
b
(
F
a
i
r
Loaded)
=
0.01
–
P
rob(Loaded
Fair)
=
0.2
–
T
ransitions
betwee
n
states
obe
y a
Markov
process
Scenario: The Occasionally Dishonest Casino
Problem
1
:
1
/
1
0
2
:
1
/
1
0
3
:
1
/
1
0
4
:
1
/
1
0
5
:
1
/
1
0
6
:
1
/
2
0
.
2
0
.
0
1
0
.
9
9
0
.
8
0
F
a
i
r
L
o
a
d
e
d
e
k
(
b
)
a
kl
An HMM for Occasionally Dishonest Casino
•
Ho
w
likel
y
i
s
a
give
n
sequence?
–
t
h
e
F
o
r
w
a
r
d
a
l
g
o
r
i
t
h
m
•
W
ha
t
i
s
th
e
mos
t
probabl
e
“path
”
for
generatin
g a
give
n
sequence?
–
t
h
e
V
i
t
e
r
b
i
a
l
g
o
r
i
t
h
m
Important Questions
For 3 Consecutive dice rolling, the outcome observed:
- 6 (first rolling outcome)
- 2 (second rolling outcome)
- 6 (third rolling outcome)
Now find out the probabilities for each possible combinations of two different types of
dices (fair and loaded) which might have produced the outcome (6,2,6). Or how likely is
if given a specific sequence?
Example: What is the probability that the consecutive outcomes (6,2,6) were
generated from the dice combination (F,L,F), which means, the first dice was Fair and
outcome was 6, Second dice was Loaded and outcome was 2 and the Last Dice was
Fair and outcome was 6?
Problem Statement for Forward Algorithm
Th
e
probabilit
y
tha
t
th
e
pat
h
1
,
2
,…,
L
i
s taken
an
d
th
e
sequenc
e
x
1
,x
2
,…,x
L
i
s
generated:
L
Pr
(
x
1
,
K
,
x
L
|
1
,
K
,
L
)
a
0
1
e
i
(
x
i
)
a
i
i
1
i
1
(assuming begin/end
are
the
only
silent
states
on
path)
How Likely is a Given Sequence?
0.
5
1
0.99
1
0.99
1
6
6
6
0.00227
Pr
(
x
,
)
a
0
F
e
F
(
6
)
a
FF
e
F
(
2
)
a
FF
e
F
(
6)
(
1
)
Pr
(
x
,
)
a
0
L
e
L
(
6
)
a
L
L
e
L
(
2
)
a
L
L
e
L
(
6
)
0.
5
0
.
5
0.
8
0.
1
0.
8
0.5
0.008
(
2
)
0.
5
0
.
5
0.
2
1
0.
0
1
0.
5
6
0.
0000417
Pr
(
x
,
)
a
0
L
e
L
(
6
)
a
L
F
e
F
(
2
)
a
F
L
e
L
(
6
)
(
3
)
FFF
(
1
)
LLL
(
2
)
LFL
(
3
)
6
,
2
,6
x
x
1
,
x
2
,
x
3
How Likely is a Given Sequence?
In this lecture, the Department of CSE at DIU delves into the intricate concepts of Hidden Markov Models and Markov Chains. Exploring topics such as Markov Chain Model notation, probability calculations, CpG Islands, and algorithms like Forward and Viterbi, this comprehensive guide equips learners with a deep understanding of these essential patterns in data analysis. Dive into the world of probabilistic modeling with practical examples and detailed explanations.

Uploaded on Feb 17, 2025 | 0 Views
Download Presentation

Please find below an Image/Link to download the presentation.
The content on the website is provided AS IS for your information and personal use only. It may not be sold, licensed, or shared on other websites without obtaining consent from the author.If you encounter any issues during the download, it is possible that the publisher has removed the file from their server.
You are allowed to download the files provided on this website for personal or commercial use, subject to the condition that they are used lawfully. All files are the property of their respective owners.
The content on the website is provided AS IS for your information and personal use only. It may not be sold, licensed, or shared on other websites without obtaining consent from the author.
E N D
Presentation Transcript
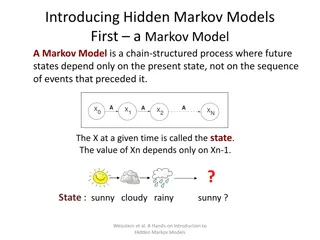
Hidden Markov Model Lecture 9 Department of CSE, DIU
CONTENTS 1. Markov Chain Model - Markov Chain Model: Notation 2. Probability of a Sequence for a Given Markov Chain Model 3. CpG Island 4. Hidden Markov Model - Forward Algorithm - Viterbi Algorithm
1. Markov Chain Model Design of a Markov Chain Model
Markov Chain Model A Markov Chain Model is defined by a set of states (A,C,G,T) and a set of transitions associated with those states.
Markov Chain Model Each and every transition from one site to another (A to G, C to A etc.) will occur with some transition probability (Will be given in Question as a Chart) There will be given a specific probability value for each transition from Begin to all other sites (Begin to A, Begin to C etc.) If no transition value is given for Begin, then assign (1/4) = 0.25 to each of the transitions (Begin -> A, Begin -> C, Begin - > G, Begin -> T) Same will be applicable for all transition to End (not shown in this picture, but shown in the previous slide s picture)
Markov Chain Model: Notation the transition parameters can be denoted by a where xi 1xi = Pr(x | x ) a xi 1xi i 1 i similarly we can denote the probability of a sequence x as L B x1 xi 1xi i=2 = Pr(x1) Pr(xi | xi 1) i=2 L a a where a represents the transition from the begin state Bxi
2. Probability of a Sequence for a Given Markov Chain Model Calculate the probability of a given sequence using Marcov Chain Model
Calculate the Probability of a given sequence P (C|A) A C G T A .18 .27 .43 .12 C .17 .37 .27 .19 G .16 .34 .38 .12 T .08 .36 .38 .18 P(CGGT) = P(C | begin) P(G | C) P(G | G) P(T | G) P(end | T) = 0.25 x 0.27 x 0.38 x 0.12 x 0.25 = 0.0007659
CpG Island Written CpG to distinguish from a C G base pair CpG dinucleotides are rarer than would be expected from the independent probabilities of C and G. Reason: When CpG occurs, C is typically chemically modified by methylation and there is a relatively high chance of methyl-C mutating into T A CpG island is a region where CpG dinucleotides are much more abundant than elsewhere. High CpG frequency may be biologically significant; e.g., may signal promoter region ( start of a gene).
Markov Chain for Discrimination suppose we want to distinguish CpG islands from other sequence regions given sequences from CpG islands, and sequences from other regions, we can construct a model to represent CpG islands (model +) a null model to represent other regions (model -) can then score a test sequence by: score(x) = logPr(x|model+) Pr(x|model-)
Markov Chain for Discrimination parameters estimated for + and - models human sequences containing 48 CpG islands 60,000 nucleotides Calculated Transition probabilities for both models
Markov Chain for Discrimination Calculated the log-odds ratio score(x) = logPr(x|model+)= Pr(x|model-) + x L L a i=1 i=1 x i 1 i= log xi 1xi a xi 1xi x x are the log-likelihood ratios of corresponding transition probabilities i 1 i A C T T A C G T -0.740 0.419 0.580 -0.803 -0.913 0.302 1.812 -0.685 -0.624 0.461 0.331 -0.730 -1.169 0.573 0.393 -0.679
Hidden Markov Model (HMM) Components: Observed variables Emitted symbols Hidden variables Relationships between them Represented by a graph with transition probabilities Goal: Find the most likely explanation for the observed variables
Why Hidden? we ll distinguish between the observed parts of a problem and the hidden parts in the Markov chain models it is clear which state accounts for each part of the observed sequence in the model above, there are multiple states that could account for each part of the observed sequence this is the hidden part of the problem the essential difference between Markov chain and Hidden Markov model
Hidden Markov Model: Notations States are decoupled from symbols x is the sequence of symbols emitted by model xiis the symbol emitted at time i A path, , is a sequence of states The i-th state in is i akr is the probability of making a transition from state k to state r: akr=Pr( i=r| i 1=k) ek(b) is the probability that symbol b is emitted when in state k ek(b) = Pr(xi= b | i= k)
Scenario: The Occasionally Dishonest Casino Problem A casino uses a fair die most of the time, but occasionally switches to a loaded one Fair die: Prob(1) = Prob(2) = . . . = Prob(6) = 1/6 Loaded die: Prob(1) = Prob(2) = . . . = Prob(5) = 1/10, Prob(6) = These are the emission probabilities Transition probabilities Prob(Fair Loaded) = 0.01 Prob(Loaded Fair) = 0.2 Transitions between states obey a Markov process
An HMM for Occasionally Dishonest Casino akl 0.99 0.80 0.01 1: 2: 1/6 1/6 1: 1/10 2: 1/10 3: 1/10 4: 1/10 5: 1/10 6: 1/2 3: 1/6 4: 1/6 5: 1/6 6: 1/6 0.2 ek(b) Fair Loaded
Important Questions How likely is a given sequence? the Forward algorithm What is the most probable path for generating a given sequence? the Viterbi algorithm
Problem Statement for Forward Algorithm For 3 Consecutive dice rolling, the outcome observed: - 6 (first rolling outcome) - 2 (second rolling outcome) - 6 (third rolling outcome) Now find out the probabilities for each possible combinations of two different types of dices (fair and loaded) which might have produced the outcome (6,2,6). Or how likely is if given a specific sequence? Example: What is the probability that the consecutive outcomes (6,2,6) were generated from the dice combination (F,L,F), which means, the first dice was Fair and outcome was 6, Second dice was Loaded and outcome was 2 and the Last Dice was Fair and outcome was 6?
How Likely is a Given Sequence? The probability that the path 1, 2, , Lis taken and the sequence x1,x2, ,xLis generated: L Pr(x1,K ,xL| 1,K , L) = a0 1 e i (xi)a i i+1 i=1 (assuming begin/end are the only silent states on path)
How Likely is a Given Sequence? x = x1,x2,x3 = 6,2,6 Pr(x, (1) ) = a0FeF(6)aFFeF(2)aFFeF(6) = 0.5 1 0.99 1 0.99 1 6 0.00227 = FFF 6 6 (1) Pr(x, (2) ) = a0LeL(6)aLLeL(2)aLLeL(6) = 0.5 0.5 0.8 0.1 0.8 0.5 = 0.008 = LLL (2) Pr(x, (3) ) = a0LeL(6)aLFeF(2)aFLeL(6) = LFL (3) = 0.5 0.5 0.2 1 0.01 0.5 6 0.0000417


")