Graphical Solution of Equations Using GDC - Step-by-Step Guide
Learn how to solve equations graphically using a Graphic Display Calculator (GDC) with step-by-step instructions. Turn on the GDC, input the equation on Y1 and Y2, draw the graphs, and find the intersection point to determine the x-value. An example equation, 2x + 8 = x + 1, is solved using this method. Visual aids and detailed guidance provided. Enhance your equation-solving skills graphically using technology.

Download Presentation

Please find below an Image/Link to download the presentation.
The content on the website is provided AS IS for your information and personal use only. It may not be sold, licensed, or shared on other websites without obtaining consent from the author.If you encounter any issues during the download, it is possible that the publisher has removed the file from their server.
You are allowed to download the files provided on this website for personal or commercial use, subject to the condition that they are used lawfully. All files are the property of their respective owners.
The content on the website is provided AS IS for your information and personal use only. It may not be sold, licensed, or shared on other websites without obtaining consent from the author.
E N D
Presentation Transcript
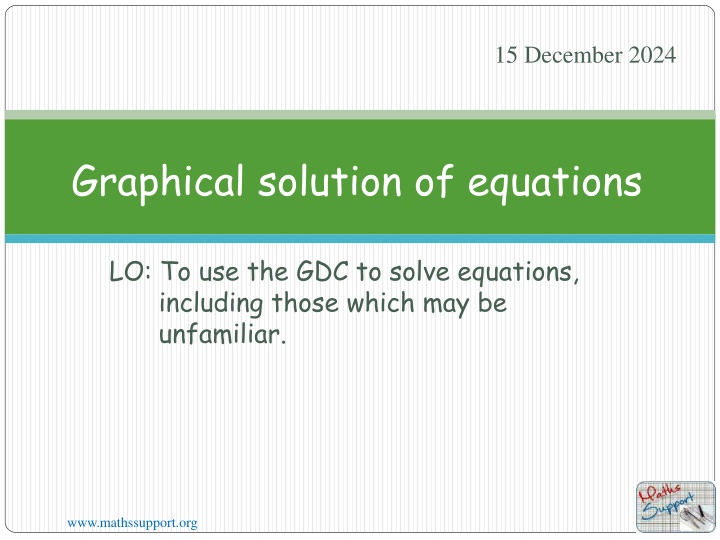
15 December 2024 Graphical solution of equations LO: To use the GDC to solve equations, including those which may be unfamiliar. www.mathssupport.org
Graphical Solution of Equations We can use the GDC to solve equations graphically To solve equations graphically follow these steps: Step 1:Turn on the GDC and select the Graph option from the menu. Step 2:Type in the left hand side of the equation on Y1. Step 3:Type in the right hand side of the equation on Y2. Step 4:Draw the graph on the screen Step 5:Find the x-value of any intersection of the two graphs. www.mathssupport.org www.mathssupport.org
Graphical Solution of Equations 2x 8 = x 1 Step 1:Turn on the GDC and select the Graph option from the menu. Step 2:Type in the left hand side of the equation on Y1. 2x 8 Solve Example 1 www.mathssupport.org
Graphical Solution of Equations 2x 8 = x 1 Step 1:Turn on the GDC and select the Graph option from the menu. Step 2:Type in the left hand side of the equation on Y1. 2x 8 Step 3:Type in the right hand side of the equation on Y2. x 1 Solve Example 1 www.mathssupport.org
Graphical Solution of Equations 2x 8 = x 1 Step 1:Turn on the GDC and select the Graph option from the menu. Step 2:Type in the left hand side of the equation on Y1. 2x 8 Step 3:Type in the right hand side of the equation on Y2. x 1 Step 4:Draw the graph on the screen Draw F6 Solve Example 1 www.mathssupport.org
Graphical Solution of Equations 2x 8 = x 1 Step 1:Turn on the GDC and select the Graph option from the menu. Step 2:Type in the left hand side of the equation on Y1. 2x 8 Step 3:Type in the right hand side of the equation on Y2. x 1 Step 4:Draw the graph on the screen Draw Step 5:Find the x-value of any intersection of the two graphs. G-Solv F5 Solve Example 1 F6 F5 INTSECT www.mathssupport.org
Graphical Solution of Equations 2x 8 = x 1 Step 1:Turn on the GDC and select the Graph option from the menu. Step 2:Type in the left hand side of the equation on Y1. 2x 8 Step 3:Type in the right hand side of the equation on Y2. x 1 Step 4:Draw the graph on the screen Draw Step 5:Find the x-value of any intersection of the two graphs. G-Solv F5 x = 7 Solution: Solve Example 1 F6 F5 INTSECT www.mathssupport.org
Graphical Solution of Equations 2x3 4x2 x = x2 + x 2 Step 1:Turn on the GDC and select the Graph option from the menu. Step 2:Type in the left hand side of the equation on Y1. 2x3 4x2 x Solve Example 2 www.mathssupport.org
Graphical Solution of Equations Solve Example 2 2x3 4x2 x = x2 + x 2 Step 1:Turn on the GDC and select the Graph option from the menu. Step 2:Type in the left hand side of the equation on Y1. Step 3:Type in the right hand side of the equation on Y2. x2 + x 2 2x3 4x2 x www.mathssupport.org
Graphical Solution of Equations Solve Example 2 2x3 4x2 x = x2 + x 2 Step 1:Turn on the GDC and select the Graph option from the menu. Step 2:Type in the left hand side of the equation on Y1. Step 3:Type in the right hand side of the equation on Y2. Step 4:Draw the graph on the screen Draw F6 2x3 4x2 x x2 + x 2 www.mathssupport.org
Graphical Solution of Equations Solve Example 2 2x3 4x2 x = x2 + x 2 Step 1:Turn on the GDC and select the Graph option from the menu. Step 2:Type in the left hand side of the equation on Y1. Step 3:Type in the right hand side of the equation on Y2. Step 4:Draw the graph on the screen Draw Step 5:Find the x-value of any intersection of the two graphs. G-Solv F5 2x3 4x2 x x2 + x 2 F6 F5 INTSECT www.mathssupport.org
Graphical Solution of Equations Solve Example 2 2x3 4x2 x = x2 + x 2 Step 1:Turn on the GDC and select the Graph option from the menu. Step 2:Type in the left hand side of the equation on Y1. Step 3:Type in the right hand side of the equation on Y2. Step 4:Draw the graph on the screen Draw Step 5:Find the x-value of any intersection of the two graphs. G-Solv F5 x -0.732 Solution: 2x3 4x2 x x2 + x 2 F6 F5 INTSECT www.mathssupport.org
Graphical Solution of Equations Solve Example 2 2x3 4x2 x = x2 + x 2 Step 1:Turn on the GDC and select the Graph option from the menu. Step 2:Type in the left hand side of the equation on Y1. Step 3:Type in the right hand side of the equation on Y2. Step 4:Draw the graph on the screen Draw Step 5:Find the x-value of any intersection of the two graphs. G-Solv F5 x -0.732 Solution: 2x3 4x2 x x2 + x 2 F6 F5 INTSECT x = 0.5 www.mathssupport.org
Graphical Solution of Equations Solve Example 2 2x3 4x2 x = x2 + x 2 Step 1:Turn on the GDC and select the Graph option from the menu. Step 2:Type in the left hand side of the equation on Y1. Step 3:Type in the right hand side of the equation on Y2. Step 4:Draw the graph on the screen Draw Step 5:Find the x-value of any intersection of the two graphs. G-Solv F5 x -0.732 Solution: x 2.732 2x3 4x2 x x2 + x 2 F6 F5 INTSECT x = 0.5 www.mathssupport.org
Graphical Solution of Equations 2x = 5 x Solve Example 3 Step 1:Turn on the GDC and select the Graph option from the menu. Step 2:Type in the left hand side of the equation on Y1. 2x www.mathssupport.org
Graphical Solution of Equations Solve Example 3 2x = 5 x Step 1:Turn on the GDC and select the Graph option from the menu. Step 2:Type in the left hand side of the equation on Y1. 2x Step 3:Type in the right hand side of the equation on Y2. 5 x www.mathssupport.org
Graphical Solution of Equations Solve Example 3 2x = 5 x Step 1:Turn on the GDC and select the Graph option from the menu. Step 2:Type in the left hand side of the equation on Y1. 2x Step 3:Type in the right hand side of the equation on Y2. 5 x Step 4:Draw the graph on the screen Draw F6 www.mathssupport.org
Graphical Solution of Equations Solve Example 3 2x = 5 x Step 1:Turn on the GDC and select the Graph option from the menu. Step 2:Type in the left hand side of the equation on Y1. 2x Step 3:Type in the right hand side of the equation on Y2. 5 x Step 4:Draw the graph on the screen Draw Step 5:Find the x-value of any intersection of the two graphs. G-Solv F5 F6 F5 INTSECT www.mathssupport.org
Graphical Solution of Equations Solve Example 3 2x = 5 x Step 1:Turn on the GDC and select the Graph option from the menu. Step 2:Type in the left hand side of the equation on Y1. 2x Step 3:Type in the right hand side of the equation on Y2. 5 x Step 4:Draw the graph on the screen Draw Step 5:Find the x-value of any intersection of the two graphs. G-Solv F5 x 1.72 Solution: F6 F5 INTSECT www.mathssupport.org
Thank you for using resources from A close up of a cage Description automatically generated For more resources visit our website https://www.mathssupport.org If you have a special request, drop us an email info@mathssupport.org www.mathssupport.org