Global Relationship Between GDP per Capita and Mineral Resource Consumption Rates in 2000
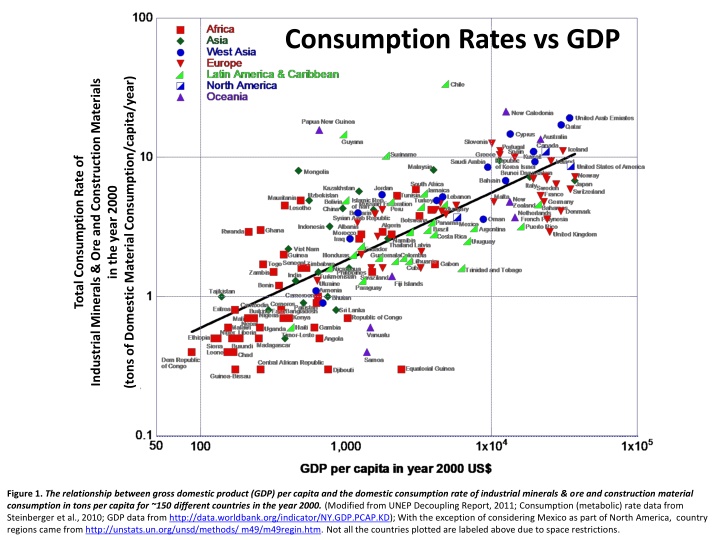
The images depict the relationship between GDP per capita and domestic consumption rates of industrial minerals, ore, and construction materials in various countries in the year 2000. The data highlights the varying consumption patterns and their correlation with economic prosperity. Additionally, specific images focus on mineral resource consumption in North America, South America, and India, providing insights into regional trends.
Download Presentation

Please find below an Image/Link to download the presentation.
The content on the website is provided AS IS for your information and personal use only. It may not be sold, licensed, or shared on other websites without obtaining consent from the author.If you encounter any issues during the download, it is possible that the publisher has removed the file from their server.
You are allowed to download the files provided on this website for personal or commercial use, subject to the condition that they are used lawfully. All files are the property of their respective owners.
The content on the website is provided AS IS for your information and personal use only. It may not be sold, licensed, or shared on other websites without obtaining consent from the author.
E N D
Presentation Transcript
Consumption Rates vs GDP (tons of Domestic Material Consumption/capita/year) Industrial Minerals & Ore and Construction Materials Total Consumption Rate of in the year 2000 Figure 1.The relationship between gross domestic product (GDP) per capita and the domestic consumption rate of industrial minerals & ore and construction material consumption in tons per capita for ~150 different countries in the year 2000. (Modified from UNEP Decoupling Report, 2011; Consumption (metabolic) rate data from Steinberger et al., 2010; GDP data from http://data.worldbank.org/indicator/NY.GDP.PCAP.KD); With the exception of considering Mexico as part of North America, country regions came from http://unstats.un.org/unsd/methods/ m49/m49regin.htm. Not all the countries plotted are labeled above due to space restrictions.
Consumption Rates vs GDP (tons of Domestic Material Consumption/capita/year) Industrial Minerals & Ore and Construction Materials Total Consumption Rate of A in the year 2000 B
Consumption Rates vs GDP (tons of Domestic Material Consumption/capita/year) Industrial Minerals & Ore and Construction Materials C Total Consumption Rate of in the year 2000 D
Mineral resource consumption (use) and extraction (mining) in North America
Mineral resource consumption (use) and extraction (mining) in South America
Mineral resource consumption (use) and extraction (mining) in India
North America India
North America South America
South America India


