Garden Valley School Division Overview and Funding Breakdown 2024-25
Explore Garden Valley School Division's mission, enrollment statistics, revenue sources, and provincial base funding details for 2024-25. Learn about their commitment to creating an inspiring learning environment and respecting the traditional lands. Check out their diverse programming and how they allocate resources for student and teacher support.

Download Presentation

Please find below an Image/Link to download the presentation.
The content on the website is provided AS IS for your information and personal use only. It may not be sold, licensed, or shared on other websites without obtaining consent from the author. Download presentation by click this link. If you encounter any issues during the download, it is possible that the publisher has removed the file from their server.
E N D
Presentation Transcript
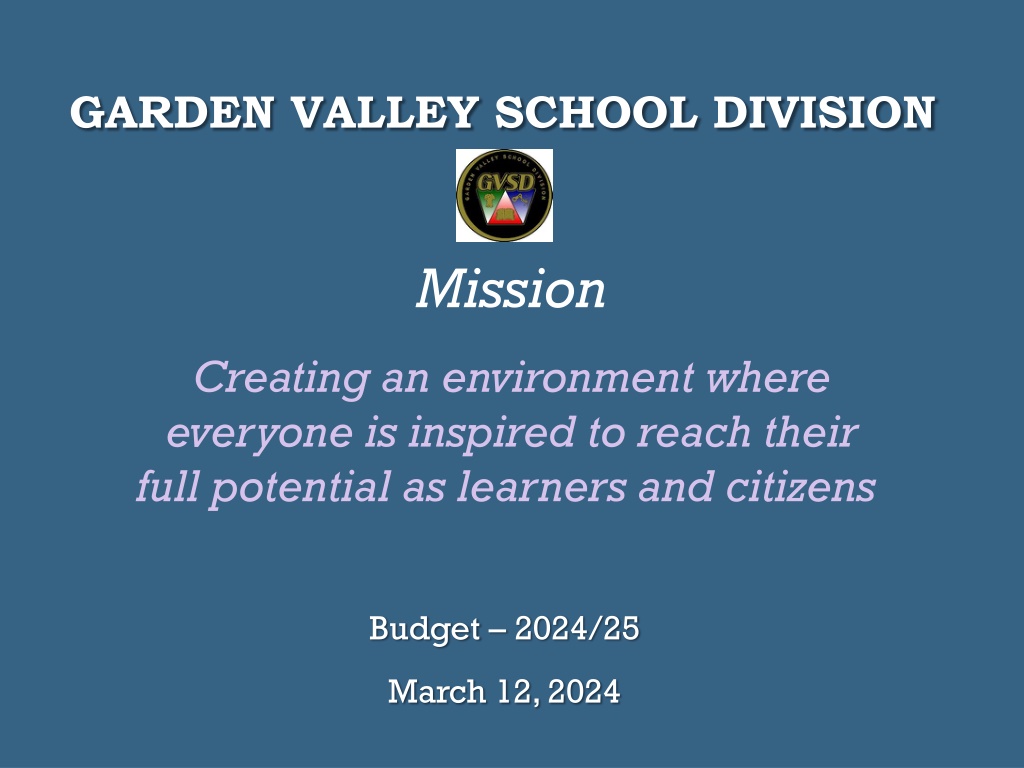
GARDEN VALLEY SCHOOL DIVISION Mission Creating an environment where everyone is inspired to reach their full potential as learners and citizens Budget 2024/25 March 12, 2024
Treaty Acknowledgement "THE GARDEN VALLEY SCHOOL DIVISION OPERATES ON THE TRADITIONAL LANDS OF THE FIRST NATIONS PEOPLE AND THE HOMELAND OF THE METIS NATION. WE RESPECT THE TREATIES THAT WERE MADE ON THIS TERRITORY.
Quick Division Profile: 4,230 students 14 schools (11 units) 479 FTE Staff Variety of Programming (e.g. RRTVA, Early Literacy Support, Resource/Guidance, Clinician Services, German, Basic French, HSAP, School Liaison Workers, Fresh Start) 3
Enrollment / Teacher Allocation Current Enrollment Actual 2024/25 Enrollment Budget 2024/25 Budget 2024/25 Budget Enrollment (FTE) Current Teacher/Admin (FTE) Change in Teacher/Admin 2023/24 -> 2024/25 Teacher/Admin (FTE) 4,230 4,297 4,149 291.25 287.6 3.60
Funding Overview Garden Valley School Division Comparison in Base Funding 2024-25 vs 2023-24 2024-25 (in '000) 2023-24 (in '000) Difference $ Total Operating Support Additional Provincial Funding 34,323 3,504 33,233 3,504 1,090 - 37,827 36,737 1,090 Total Provincial Government Funding 20,489 18,178 2,311 Municipal Government 1,023 819 204 Other Revenue 59,339 55,734 3,605
Provincial Base Funding Overview 2024-25 2024-25 Increase in Operating Support Support Division (in '000) (in '000) 2024-25 Increase in Op Support Net of Nutrition (in '000) 2024-25 Nutrition Funding (in '000) 2024-25 Operating Support % Increase Operating Garden Valley 34,300 1,100 365 735 2.0% Border Land 20,200 400 300 100 0.7% Hanover 69,000 4,600 600 4,000 6.2% Lord Selkirk 29,500 600 500 100 0.6% Mountain View 26,400 500 300 200 0.9% Portage la Prairie 24,500 1,100 500 600 2.1% Prairie Rose 16,700 400 200 200 1.8% Red River Valley 15,700 300 100 200 0.8% Sunrise 33,000 600 400 200 0.7% Western 17,000 800 100 700 4.1% Brandon 74,200 6,800 1,000 5,800 8.5% Louis Riel 112,900 6,600 1,400 5,200 4.7% Pembina Trails 90,400 2,900 1,200 1,700 2.0% River East/Trans 130,800 8,200 1,300 6,900 5.6% Seven Oaks 99,400 5,900 900 5,000 5.3% St. James/Assin 51,900 1,000 600 400 0.7% Winnipeg 229,800 7,200 4,800 2,400 1.0%
REVENUE HIGHLIGHTS 2024/25 BUDGET Year over year funding increased by roughly $1.1M or 2.9% Additional Operating Support increased by $564K New - Nutrition Program Funding of $365K New Support for Anticipated Enrolment Growth - $161K If you remove the Nutrition funding, our increase would be $725K or 2.0%
EXPENSES Chart Title Salaries & Benefits 84% Services 8% Supplies, Materials and Minor Equipment 5% Transfers 3%
Operating Expenses, By Object ( 000) Budget Budget Increase Change 2024/25 2023/24 (Decrease) % ('000) ('000) ('000) Salaries 45,155 43,198 1,957 4.5% Employees Benefits and Allowances 4,732 4,518 214 4.7% Services 4,500 4,378 122 2.8% Supplies, Materials and Minor Equipment 3,459 2,997 462 15.4% Short Term Loan Interest and Bank Charges - 36 (36) -100.0% Transfers 1,479 1,437 42 2.9% 59,325 56,564 2,761 4.9%
Operating Expenses, By Function ( 000) Budget Budget Increase Change 2024/25 2023/24 (Decrease) % Regular Instruction 34,561 33,203 1,358 4.1% Student Support Services 10,919 10,367 552 5.3% Nutrition Program 365 - 365 0.0% Community Education and Services 81 79 2 2.5% Divisional Administration 1,742 1,685 57 3.4% Instructional and Other Support Services 1,741 1,611 130 8.1% Transportation of Pupils 3,073 2,992 81 2.7% Operations and Maintenance 5,872 5,662 210 3.7% Fiscal 971 965 6 0.6% 59,325 56,564 2,761 4.9%
Additional Positions Description FTE Budget Additional School Administration 2.5 300,000 1 Additional High School Administrative Assistant 1 35,000 Transportation Assistant (1/2 to 1 FTE) .5 30,000 Indigenous Coordinator .5 ____50,000 415,000
NUTRITION PROGRAM Garden Valley received $365,000 in funding for 2024/25 for a School Nutrition Program Provincially $30M Program for 2024/25 Guiding Principles Students must not face any barriers or stigma to participating in the nutrition program Leverage existing partnerships to augment and improve current school nutrition programs Follow Canada s nutritional food guide
NUTRITION PROGRAM Funding A minimum of 65% of funding must go to food purchases Planning Divisions are required to submit their plans in the spring of 2024 Must be operational by September 2024
CAPITAL EXPENDITURE HIGHLIGHTS 2024/25 J.R. Walkof Link - $150,000 Winkler Elementary Office Relocation - $350,000 Northlands Parkway Window Replacement - $500,000
PORTIONED ASSESSED LAND VALUE ( 000) 2024 2023 Increase $ Increase % Assessment Assessment Rhineland Roland Stanley Winkler 239,489 30,167 544,101 975,389 234,505 30,094 536,692 961,701 4,984 73 7,409 13,688 2.1% 0.2% 1.4% 1.4% Total 1,789,146 1,762,992 26,154 1.5%
MILL RATE 16 15.02 15 13.73 14 13.43 13.12 13 12.06 12 11.46 11 10 2018 2019 2020 2021 2022 2023 2024 2025 Year Mill Rate 2019 2020 2021 2022 2023 2024 15.02 13.73 13.43 13.12 11.46 12.06 5.24%
Estimated Impact on Education Property Taxes Property Classification Increase 2024 2023 2022 2021 2020 $ 300K Home (before credit) $ 500K Home (before credit) 80 1,630 1,550 1,770 1,810 1,850 130 2,710 2,580 2,950 3,020 3,090 $ 500K Business 200 3,920 3,720 4,260 4,360 4,460 $ 1M Business 390 7,840 7,450 8,530 8,730 8,920 $ 2M Agricultural 310 6,270 5,960 6,820 6,980 7,140 $ 5M Agricultural 780 15,680 14,900 17,060 17,460 17,850
Schedule of Revenue & Expenses ( 000) 2024/25 Budget 2023/24 Budget Revenue Provincial Government Municipal Government Other School Divisions Other Sources 37,827 20,489 345 678 37,280 18,178 345 474 59,339 56,277 Expenses Regular Instruction Student Support Services Community Education & Services Nutrition Program Divisional Administration Instructional & Support Services Transportation of Pupils Operations & Maintenance Fiscal 34,561 10,919 33,204 10,366 79 365 1,742 1,741 3,073 5,872 972 79 0 1,685 1,611 2,992 5,662 964 59,324 56,563 Current Year Operating Surplus (Deficit) $ 15 _ ( 286 )
QUESTIONS ? Mission: Creating an environment where everyone is inspired to reach their full potential as learners and citizens