FY2017 Preliminary Budget Presentation Highlights
The FY2017 Preliminary Budget Presentation for the General Fund outlines key financial details and initiatives for various departments within the organization. The budget includes revenue estimates, expenditure comparisons, staffing details, and specific goals for financial planning and risk management. Efforts to reduce spending, implement enterprise risk management, and ensure compliance with financial policies are highlighted to achieve fiscal responsibility and accountability. Specific revenue changes and budget adjustments are explained, including areas such as property taxes, sales tax, and other tax revenues.
Download Presentation

Please find below an Image/Link to download the presentation.
The content on the website is provided AS IS for your information and personal use only. It may not be sold, licensed, or shared on other websites without obtaining consent from the author.If you encounter any issues during the download, it is possible that the publisher has removed the file from their server.
You are allowed to download the files provided on this website for personal or commercial use, subject to the condition that they are used lawfully. All files are the property of their respective owners.
The content on the website is provided AS IS for your information and personal use only. It may not be sold, licensed, or shared on other websites without obtaining consent from the author.
E N D
Presentation Transcript
FY2017 Preliminary Budget Presentation General Fund 1
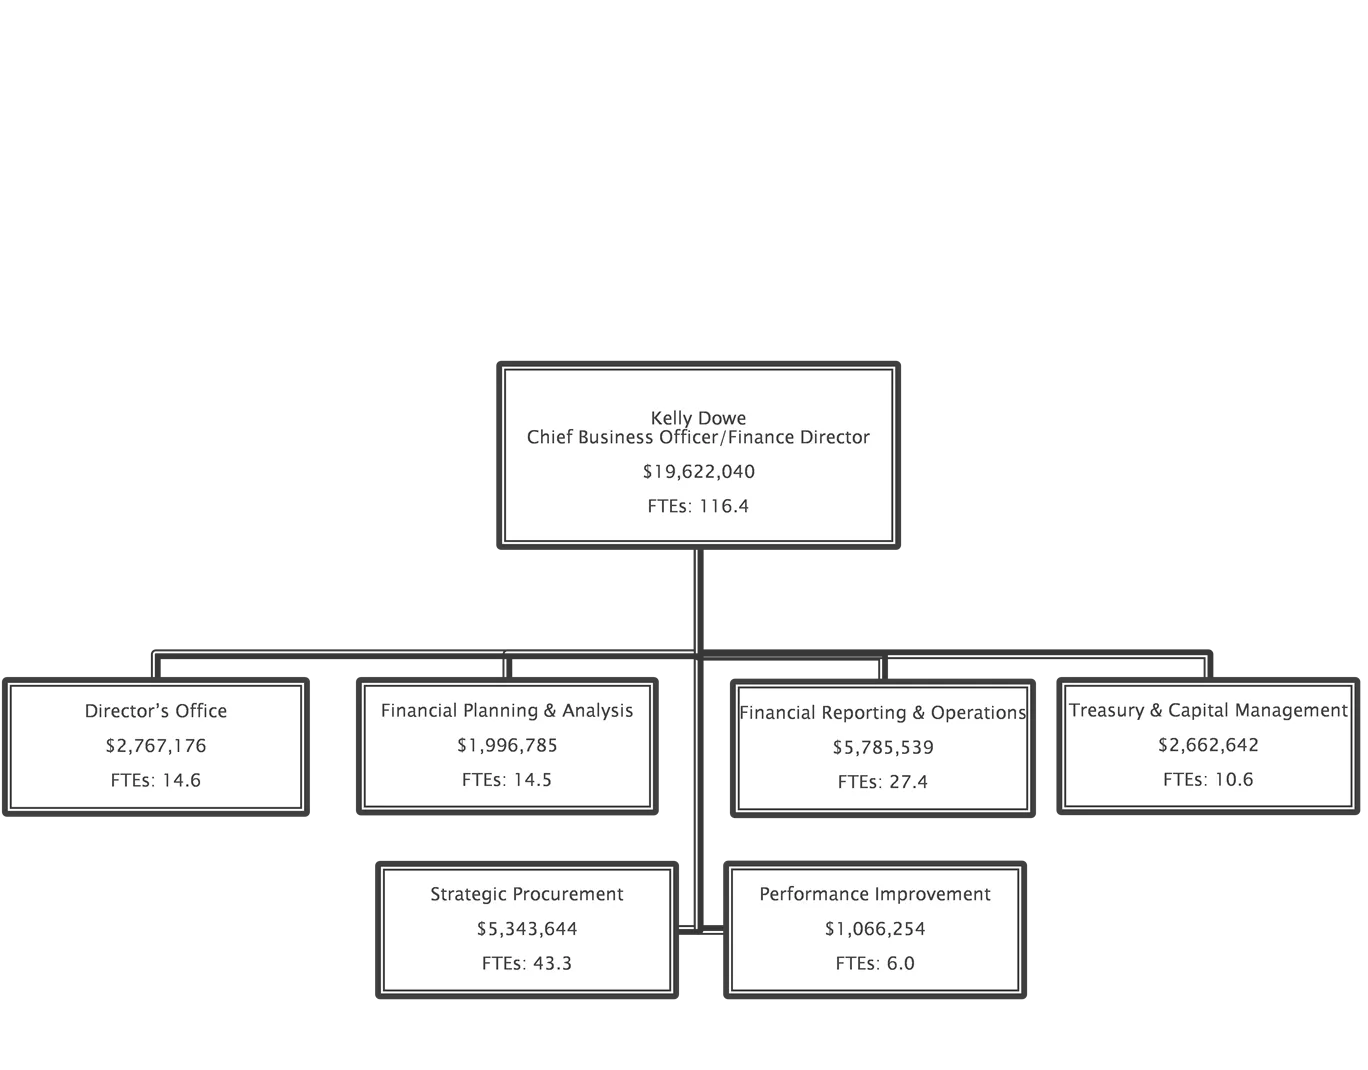
Kelly Dowe Chief Business Officer/Finance Director $19,622,040 FTEs: 116.4 Treasury & Capital Management $2,662,642 FTEs: 10.6 Financial Planning & Analysis $1,996,785 FTEs: 14.5 Director s Office $2,767,176 FTEs: 14.6 Financial Reporting & Operations $5,785,539 FTEs: 27.4 Strategic Procurement $5,343,644 FTEs: 43.3 Performance Improvement $1,066,254 FTEs: 6.0 2
Support Administrations efforts to continue to reduce spending through elimination of inefficiencies and contract renegotiations Present Long Range Financial Plan to address structural financial issues by December 2016 Expand and implement Enterprise Risk Management (ERM) initiatives for new business processes, (e.g. financial and performance management review, SAP security access review) Launch vendor performance management program Implement full compliance with financial policies adopted by City Council Implement E.O. 1-53 and accompanying A.P. 4-10 to instill performance-based budgeting through fiscal responsibility, accountability, and responsive public services and civic investments 3
Fund Revenue FY16 Budget Revenue FY17 Preliminary Estimates +/- $/% Expenditure FY16 Budget Expenditure FY17 Preliminary Estimates +/- $/% General Fund 1000 $1,826,020 $1,769,507 ($56,513)/ (3.1%) $20,254 $19,622 ($632)/ (3.1%) 4
FY17 Budget - Finance Department Revenues ($ in thousands) FY16 Current FY17 Proposed Budget 1,133,191 $ 615,000 Category Property Taxes Sales Tax Other Tax Revenues Interest Miscellaneous/Other Other Fines and Forfeits Direct Interfund Services Total Budget 1,114,029 $ 688,837 Var($'s) Var(%) 19,162 $ (73,837) -10.7% 230 0 (1,981) -59.4% (93) -71.0% 7 (56,513) $ 1.7% 16,679 3,000 3,335 131 16,909 3,000 1,354 1.4% 0.0% 38 15 8 87.5% -3.1% 1,826,020 $ 1,769,507 $ 5
Property taxes Budgeted higher based on projected revenues at the revenue cap Sales tax Lower primarily due to the downturn in oil prices Other Tax Revenues Mixed Beverage Tax revenues are budgeted to increase by $290k, offset by decrease in Bingo Tax by $60k Miscellaneous/Other Primarily lower due to moving revenues for payment in lieu of taxes (related to Foreign Trade Zone Agreement) to Mayor's office 6
Category Expenditures FY15 Actual Expenditures FY16 Budget Expenditures FY16 Estimates Expenditures FY17 Preliminary Estimates +/- $/% FY17 Prelim. Est. vs FY16 Budget Personnel $12,739 $14,211 $13,660 $14,244 $33/ 0.23% Supplies $101 $93 $102 $85 ($8)/ (8.6%) Other Services and Charges $5,518 $5,950 $6,021 $5,293 ($657)/ (11.0%) Total $18,358 $20,254 $19,783 $19,622 ($632)/ (3.1%) 7
FY2017 General Fund Preliminary Budget Expenditures Net Change to FY2016 Current Budget Notes FY16 Current Budget FY17 Preliminary Budget 20,254,083 $ 19,622,040 (632,043) Incremental Increase/(Decrease) Growth (%) (3.1%) Explanation of Incremental Increase/(Decrease) Contractual/Mandated Increases: HOPE Pension Health Net Interfund Billings 159,620 77,458 54,505 10,900 $ 302,483 Subtotal Contractual/Mandated Increases Cost Savings (Decreases) Department savings initiatives Termination pay (854,526) (80,000) $ (934,526) Subtotal Contractual/Mandated Increases Incremental Increase/(Decrease) $ (632,043) 8
Filled/Vacant FTE Impact Reduction Type FY17 Reduction Reduction in supplies and services N/A $ 53,344 Eliminate vacancy in the Financial Reporting & Operations Division 1.0 78,882 Eliminate vacancy in the Strategic Procurement Division 1.0 154,854 Enterprise Data Management program consolidation savings 0.0 375,830 Consolidate positions in the Financial Planning & Analysis Division 1.0 77,575 Reduce management consulting for fee cost of services study 0.0 114,041 Finance Department Total 3.0 $ 854,526 9
FINANCE DEPARTMENT Workforce Analysis EEOJ Category, Ethnicity, and Gender Males Females Totals EEOJ Category White Black Hispanic Asian /P.I. Totals White Black Hispanic Asian /P.I. Totals White Black Hispanic Asian/P.I. Totals A: Officials & 7 4 1 3 15 48.4 39 36.8 1 20 55 38.7 3 6 4 3 16 51.6 67 63.2 4 80 87 61.3 10 32.3 17 16 0 0 27 19 10 32.3 51 48.1 4 80 65 45.8 5 6 31 100 106 100 5 100 142 100 % B: Professionals 22.6 11 10.4 0 0 18 12.7 12.9 13 12.3 1 20 18 12.7 3.2 5 4.7 0 0 6 4.2 9.7 10 9.4 0 0 13 9.2 9.7 6 5.7 0 0 9 6.3 19.4 38 35.8 3 60 47 33.1 12.9 13 12.3 0 0 17 12 8.1 10 11.6 1 33.3 17 11.2 16.1 18 17 0 0 23 16.2 19.4 20 18.9 1 20 27 19 % C: Administrative Support % TOTALS % 11
Central Service Revolving Fund HITS FMD HFD GSD/Energy PWE General Fund* 77% Revolving Fund* 23% *FY17 Preliminary budget percentages are approximate 12
 undefined

