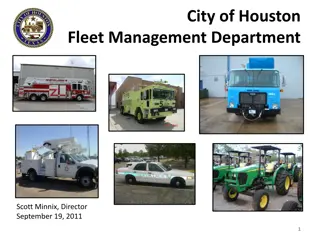
Fleet Management Services Annual Report FY 2017
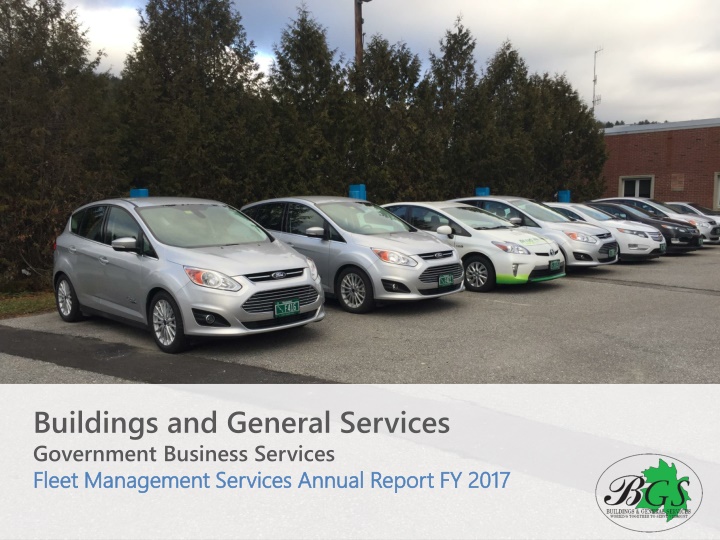
Fleet Management Services (FMS) provides centralized management and control of the State's vehicles, ensuring state agencies receive well-maintained vehicles to meet their unique missions. The program summary outlines policies and goals, focusing on safe, economical vehicles, preventive maintenance, and reducing environmental impact. Operating as an Internal Service Fund, the program aims to generate revenue to cover expenses while providing vehicles at the lowest rate possible.

Download Presentation

Please find below an Image/Link to download the presentation.
The content on the website is provided AS IS for your information and personal use only. It may not be sold, licensed, or shared on other websites without obtaining consent from the author.If you encounter any issues during the download, it is possible that the publisher has removed the file from their server.
You are allowed to download the files provided on this website for personal or commercial use, subject to the condition that they are used lawfully. All files are the property of their respective owners.
The content on the website is provided AS IS for your information and personal use only. It may not be sold, licensed, or shared on other websites without obtaining consent from the author.
E N D
Presentation Transcript
Buildings and General Services Government Business Services Fleet Management Services Annual Report FY 2017 Fleet Management Services Annual Report FY 2017
Program Summary Fleet Management Services (FMS) provides centralized management and control of the State s vehicles, except for those exempt by statute or by Commissioner of Buildings & General Services. Vehicle transportation is vital to accomplishing many of the tasks of state government, and vehicles serve a wide variety of needs from occasional administrative travel to routine off-road use. FMS is committed to providing state agencies and departments with appropriate, well-maintained vehicles, and the necessary tools and resources, to allow them to meet their unique missions.
Authority Administrative Bulletin 2.3 outlines State policy regarding the provisions and use of state-owned motor vehicles within the constraints of the law as reflected in 3 V.S.A. 217(a): No state department or agency, board, or commission, except the governor, the commissioner of the department of buildings and general services, or the commissioners of the departments of fish and wildlife and public safety for use of employees who are sworn law enforcement officers, may maintain or provide passenger vehicles subject to such exceptions as may be made by the commissioner of buildings and general services in circumstances where there is documented evidence of necessity based upon the requirements or conditions of individual state programs.
Mission To provide agencies and departments with safe, economical vehicles for use on state business, and reduce the environmental impact of state travel.
Goals Provide safe, economical vehicles to agencies and departments Preventive maintenance compliance Manufacturer recommended maintenance completed within 30 days or 1,200 miles when due Manufacturer recalls Recall work addressed within 30 days from notice or parts availablility . Vehicles procured at lowest possible cost, and right-sized Formal justification process used to right-size vehicles and the overall fleet Vehicle procurement considers total cost of ownership, highest fuel economy, and lowest tailpipe emissions Educate and inform employee travel options Encourage use of trip calculator to determine lowest cost travel option Annually inform agencies and departments of high mileage drivers and potential savings available Reduce environmental impact of state travel Reduce emissions, increase fuel efficiency, and reduce fuel consumption Vehicles matches expected use (right-size) Deploy plug-in electric hybrid and all-electric vehicles, when feasible Procure vehicles with the highest fuel economy, and lowest tailpipe emissions, when economical Inform agencies and departments of excessive idling when telematics data is available
Program Revenues/Expenses The program operates as an Internal Service Fund. The objective to generate sufficient revenue to cover operating expenses, while providing vehicles at the lowest rate possible. Fleet lease rates were lowered at the onset of FY 2016 to adjust the program fund balance, and pass savings back to departments. $6,000,000 $5,000,000 $4,000,000 $3,000,000 $2,000,000 $1,000,000 $0 FY2013 FY2014 FY2015 FY2016 FY2017 Operating Revenue $4,980,950 $5,355,022 $5,423,635 $4,463,300 $4,508,577 Operating Expenses $4,977,828 $4,976,637 $5,237,456 $5,009,765 $5,418,399
Monthly Rate Comparison Fleet Rates vs. State Contract Rental Rates Monthly Fleet Vehicle Lease Rate Monthly State Rental Contract Rate Cost Savings % Saved Intermediate Sedan Hybrid Sedan Intermediate 4WD SUV 1/2 Ton 4WD Truck $744 $947 $1,095 $1,061 $282 $462 $326 $360 $415 62% 66% 67% 61% $621 $735 $646 Average for Vehicle Classes $3,847 $1,383 $2,464 64% Average Monthly Fleet Rate Savings compared to Average Monthly Contracted Rates using 2017 rates is 64% savings.
Lease Vehicle Assignments The program provides long-term lease vehicles to agencies and departments whose travel history indicates that use of centralized fleet vehicles will result in savings over the federal mileage reimbursement rate, or their mission justifies need for a vehicle. 27 Departments 106 99 626 Lease Vehicles 91 71 49 46 45 31 16 13 7 6 5 5 5 4 4 4 4 4 2 2 2 2 1 1 1 Criminal Justice AOT DAIL FPR DII OVHA Tax BGS DMH Sec of State DMV Corrections Agriculture AG Lottery DEC Def Gen Public Service DCF AHS Central VDOL ANR Enforcement Health Judiciary Liquor Control Veterans' Home Military
Motor Pool Utilization Motor pools are located at various state campuses throughout the state, and provide daily rental cars to all employees for state travel. Utilization percentages are based on the number of rental days the vehicles are in use compared to the total number of rental days the vehicles are available. The program aims to achieve 65% utilization at each motor pool location to meet rental demand, while generating sufficient revenue to cover operational costs. The program is successful when the average cost per mile paid by departments is less than the federal mileage reimbursement rate. In FY 2017, the average cost per mile paid by departments to use motor pool was $0.08 less than the mileage reimbursement rate, saving the State approximately $65,394. Montpelier State St Montpelier Green Mtn Dr Montpelier Natl Life Dr Waterbury Burlington Cherry St Burlington Pearl St (opened Oct 2016) Rutland Springfield (opened April 2017) Utilization Percent 67% 39% 54% 45% 76% 49% 56% 34% Miles Traveled 226,579 251,438 84,002 41,097 110,455 8,386 90,665 4,809 Rental Bookings (Days) 2,034 2,121 705 454 1,325 91 1,103 43 Rental Availability (Days) 3,045 5,396 1,314 1,000 1,751 186 1,957 128 Number of Vehicles (end of FY17) 12 21 4 4 8 1 8 2 Average Cost per Mile: Total Motor Pool Miles Driven: 817,431 Total Number of Vehicles: 60 Total Rental Days for FY17: 7,876 Combined Motor Pool Utilization 53% $0.46
Fleet Composition The program right-sizes vehicles by matching the expected use with the most economical, fuel-efficient, and lowest emissions vehicle possible. Administrative travel and passenger transport is best accomplished by partial- or zero-emission sedans, and larger vehicles reserved for bulky or heavy cargo transport, off-road travel, or other special needs. 450 384 400 FY 2013 (547) 326 FY 2014 (582) 350 288 FY 2015 (655) 300 236 218 FY 2016 (670) 250 191 185 173 169 FY 2017 (734) 165 200 150 108 103 101 91 89 100 53 51 50 49 48 50 22 21 21 21 19 0 FY17 Inventory as of July 3, 2017 includes 48 transitioning new/retired units
Fuel Purchases The program supports the reduction of greenhouse gas emissions by assigning the lowest emission, most fuel efficient vehicle, which meets expected needs established by agencies and departments through a justification review. In addition to vehicle fuel economy, travel distance primarily drives fuel purchases. The program aims to increase the average miles traveled per fuel gallon purchased. BGS Fleet Fuel Purchases by Fiscal Year 12,000,000 500,000 450,000 10,000,000 400,000 350,000 8,000,000 300,000 6,000,000 250,000 200,000 4,000,000 150,000 100,000 2,000,000 50,000 0 0 FY 2013 FY 2014 FY 2015 FY 2016 FY 2017 Fuel Purchases (Gallons) 399,179 419,614 436,715 487,426 425,265 Fleet Miles Driven* 8,248,200 8,442,960 8,878,453 10,001,602 9,917,476 Avg Miles per Gallon 20.66 20.12 20.33 20.52 23.32 Fuel Purchases (Gallons) Fleet Miles Driven* Avg Miles per Gallon *Mileage data is collected from driver reports, which may contain inaccurate entries. Obvious outliers are removed, however mileage data is considered approximate.
Reimbursed Travel & Fleet Utilization The program s mission is to provide fleet vehicles to agencies and departments when it will result in savings over the federal mileage reimbursement rate, or when their mission requires a fleet vehicle. Our goal is to reduce travel performed in personal vehicles at the full reimbursement rate, when using a fleet vehicle is more cost effective. 18,000,000 16,000,000 14,000,000 12,000,000 Miles Traveled and Reimbursement Dollars Paid 10,000,000 8,000,000 FY 2013 6,000,000 FY 2014 4,000,000 FY 2015 2,000,000 FY 2016 0 Reimbursed Miles Driven Fleet Miles Driven Total Miles Driven Reimbursed Miles Paid Fleet Use Payments Total Paid for Fleet Use & Reimbursed Miles $10,308,062 FY 2017 FY 2013 9,532,836 8,248,200 17,781,036 $5,327,112 $4,980,950 FY 2014 8,979,039 8,442,960 17,421,999 $5,056,159 $5,355,022 $10,411,181 FY 2015 7,238,704 8,878,453 16,117,157 $3,998,988 $5,423,635 $9,422,623 FY 2016 6,640,021 10,001,602 16,641,623 $3,504,223 $4,463,300 $7,967,523 FY 2017 5,274,338 9,917,476 15,191,814 $2,839,477 $4,508,577 $7,348,054 Fleet mileage data is collected from driver reports, which may contain inaccurate entries. Obvious outliers are removed, however mileage data is considered approximate. Vehicles exempt from the Fleet program are not included in Fleet program reports.
High Mileage Drivers As a cost saving strategy, the program informs agencies and departments of their high mileage drivers based on expense data and fleet rates from the previous fiscal year, and recommends using the lowest cost option. An employee is considered a high mileage driver when their annual mileage reimbursements exceed the cost for their department to lease a fleet sedan. The current annual threshold is 10,000 miles, while in past years the threshold has been as much as 14,000 miles. Fleet lease rates were reduced July 2015, which now makes using a fleet sedan more economical at a much lower annual threshold. Cost of High Mileage Drivers FY 2013 - 2017 $1,200,000 $1,143,489 $1,000,000 $1,054,166 $966,414 $800,000 $790,919 $782,877 $679,746 $600,000 $560,617 $400,000 $378,842 $200,000 $0 FY10 (115) FY11 (85) FY12 (88) FY13 (96) FY14 (128) FY15 (60) FY16 (35) FY17 (86) Fiscal Year (Number of Drivers)
Locations with Highest Mileage Reimbursements The program seeks to increase the use of fleet vehicles at these locations, by making cars available through a motor pool, when possible. This reimbursement data is only one consideration in selecting potential motor pool locations; available parking, partnerships with departments for dispatch, and other factors are considered. FY 2017 Employee Full-Rate Mileage Reimbursements by Departing Location $152,006 $149,636 $146,260 $145,027 $160,000 $106,328 $140,000 $91,966 $120,000 $80,645 $71,098 $70,881 $100,000 $64,393 $80,000 $60,000 $40,000 $20,000 $0
Fleet Disposal: Return of Investment The program aims to achieve a 25% average return of investment for fleet vehicles*, which is the return on investment attained by Elite fleets, according to Government Fleet magazine.1 The program s replacement planning and remarketing strategies are designed to maximize the return of investment. Average resale return of original purchase amount 39% 39% 40% 38% 36% 32% 32% 34% 30% 25% 20% 10% 0% FY10 FY11 FY12 FY13 FY14 FY15 FY16 FY17 *Vehicles disposed by insurance settlement, have a salvage title, or were transferred to program after purchase, are excluded from ROI calculation. 1. Thi Doa, Author. Elite Fleets Continue Tradition of Excellence. Government Fleet. Published July 2013. http://www.government-fleet.com/article/story/2013/07/elite-fleets-continue-tradition-of-excellence.aspx.
Plug-In Electric Vehicles (Hybrid and Full-EV) The 2016 State Agency Energy Plan and Vermont Zero Emission Vehicle Action Plan establish a goal to convert 25% of light-duty state fleet vehicles to plug-in electric by 2025. Accordingly, Fleet Management Program must continue working with agency operations staff to identify opportunities to add more plug-in hybrids, and all-electric vehicles. Within the 2016 Agency Energy Implementation Plan, the Fleet Management Program has also committed to adding 5 plug-in electric vehicles each year, to help meet the goal to reduce greenhouse gas emissions. FY 2017 Fleet Inventory Avg Vehicle Purchase Cost Avg Fuel Economy Avg Miles Driven per Vehicle Avg Fuel Consumed Per Vehicle EPA Gas Only Fuel Economy Avg Estimate All Electric Range on Full Charge Toyota Prius (plug- in hybrid 3 $28,764 43 MPG 10,731 250 gal 49 MPG 0-6 mi. Ford C-Max Energi (plug-in hybrid electric) $29,753 16 36 MPG 12,048 329 gal 36 MPG 0-19 mi. Chevy Volt (plug-in hybrid electric) 6 $33,283 48 MPG 9,959 218 gal 40 MPG 36-49 mi.
Fleet Vehicle Accident Losses Vehicle accident repairs are covered with program funds, with exception of a few special-use vehicles. The driver s agency or department is only responsible to pay a minimal deductible per incident. FMS pursues and manages claims to recover damages caused by a negligent third party, through the State s contracted vendor for third-party administrative services. Summary: JUD (1) $2,962 3% Accident damages Damage recovery - $ 27,523 Department deductibles - $ 27,205 Net Cost to FMS $ 47,509 $102,237 OTHER DEPTS (9) $8,405 8% LOTT (3) $3,258 3% BGS (17) $15,632 15% AGR (6) $3,356 3% DEF GEN (3) $3,829 4% Total Accidents 96 BGS (17) DCF (10) VTrans (13) DOC (21) AOE (1) VDH (8) ADS/DII (1) FPR (3) DEF GEN (3) AGR (6) LOTT (3) JUD (1) OTHER DEPTS (9) DCF (10) $14,492 14% ADS/DII (1) $4,518 5% VDH (8) $5,757 6% FPR (3) $4,474 4% VTrans (13) $14,055 14% AOE (1) $9,521 9% DOC (21) $11,977 12%
Exempt Vehicle Inventory The program is responsible to maintain the official inventory of all state-owned vehicles per Agency of Administration Bulletin 2.3. Agencies and departments granted exemption from the program are required to report annually on their state vehicles, with the exception of Agency of Transportation and Department of Public Safety, which are managed and reported independently. 600 506 12 Departments 1,240 Exempt Vehicles 500 445 400 300 200 148 86 100 26 15 5 4 2 1 1 1 1 1 0 Inventory as of July 2017
State-Owned Vehicle Inventory Based on data collected from agencies and departments, the number of state-owned vehicles has steadily increased since FY 2011, some of which is likely attributable to efforts to shift state travel to lower cost fleet vehicles. State-Owned Vehicle Inventory History FMS Vehicles State Fleet Size Exempt Vehicles Total Vehicles 2000 FY 2011 504 1193 1697 1950 FY 2012 534 1208 1742 1900 FY 2013 537 1218 1755 1850 FY 2014 564 1247 1811 1800 1750 FY 2015 639 1250 1889 1700 FY 2016 668 1250 1918 1650 FY 2017 734 1240 1974 1600 1550 FY 2011 FY 2012 FY 2013 FY 2014 FY 2015 FY 2016 FY 2017


")