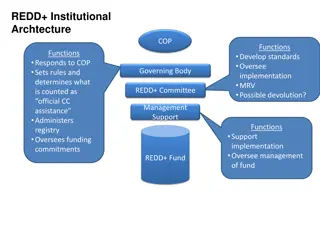
Financing Strategies for REDD+ Initiatives

 undefined
C
r
i
m
e
i
n
E
n
g
l
a
n
d
a
n
d
W
a
l
e
s
Year ending September 2017
These are summary briefing slides
For full interpretation, commentary and detailed
definitions see the
and associated
data tablesstatistical bulletin


O
v
e
r
v
i
e
w
o
f
t
h
e
l
a
t
e
s
t
c
r
i
m
e
s
t
a
t
i
s
t
i
c
s
•
Latest figures indicate that crime continued to fall compared with the
previous year
•
However, trends vary for different forms of crime
•
Many of the most frequently occurring crimes were at levels similar
to the previous year or fell, including fraud, criminal damage and
most types of theft and violent crime
•
Evidence of increases in some of the less frequently occurring, but
higher harm offences such as knife and gun crime. Also evidence of
rises in some types of property crime; in particular, vehicle-related
theft and burglary.
•
These rises were relatively low in volume and were more than offset
by falls seen across other higher volume offence types shown by the
CSEW.
F
a
l
l
s
i
n
c
r
i
m
e
s
i
n
c
e
t
h
e
m
i
d
1
9
9
0
s
C
r
i
m
e
e
s
t
i
m
a
t
e
d
b
y
t
h
e
s
u
r
v
e
y
h
a
s
f
a
l
l
e
n
c
o
n
s
i
d
e
r
a
b
l
y
f
r
o
m
t
h
e
p
e
a
k
l
e
v
e
l
s
s
e
e
n
i
n
1
9
9
5
.
E
n
g
l
a
n
d
a
n
d
W
a
l
e
s
,
y
e
a
r
e
n
d
i
n
g
D
e
c
e
m
b
e
r
1
9
8
1
t
o
y
e
a
r
e
n
d
i
n
g
S
e
p
t
e
m
b
e
r
2
0
1
7
Latest estimates show around 2 in 10 adults were
victims of crime compared with 4 in 10 adults in 1995
(even though the latter estimate excludes fraud and
computer misuse)
C
S
E
W
F
r
a
u
d
a
n
d
c
o
m
p
u
t
e
r
m
i
s
u
s
e
•
First year-on-year comparisons show 15% fall
•
Cover offences against the general population, and
exclude those against businesses and cyber attacks on
organisations such as the ransomware attack which struck
the NHS and other organisations in May 2017.
•
Fraud
– down 10% from 3.6m to 3.2m offences
•
Consumer and retail fraud – down 20% (to 0.7 million)
•
Bank and credit account fraud – no change (2.4 million)
•
Computer misuse
– down 24% from 2m to 1.5m offences
•
Computer viruses – down 26% (to 1 million)
•
Unauthorised access to personal information – down 19%
(to 0.5 million)
L
o
n
g
-
t
e
r
m
f
a
l
l
i
n
v
i
o
l
e
n
t
c
r
i
m
e
•
Continuation of year-on-year changes not being statistically significant
•
But cumulative effect of non-significant changes each year is a
significant decrease of 29% compared with yr end March 2013
•
Latest survey year = 2 in every 100 adults were a victim
•
1995 = 5 in 100 adults
Latest estimate:
1.2 million
incidents
No significant
change from
previous year
T
r
e
n
d
s
i
n
C
r
i
m
e
S
u
r
v
e
y
f
o
r
E
n
g
l
a
n
d
a
n
d
W
a
l
e
s
v
i
o
l
e
n
c
e
,
y
e
a
r
e
n
d
i
n
g
D
e
c
e
m
b
e
r
1
9
8
1
t
o
y
e
a
r
e
n
d
i
n
g
S
e
p
t
e
m
b
e
r
2
0
1
7
R
i
s
e
s
i
n
o
f
f
e
n
c
e
s
i
n
v
o
l
v
i
n
g
k
n
i
v
e
s
c
o
n
t
i
n
u
e
d
•
Highest volume recorded since 2011 when comparable records began
•
Some recording improvements but also some genuine increases.
•
Hospital admissions data for England showed a 7% increase in
admissions for assault by a sharp object ending March 2017.
Offences involving
knives recorded by
the police increased
by 21% (a rise of
around 6,500
offences, up to
37,443)
Follows increases
seen over the last 3
years
O
f
f
e
n
c
e
s
i
n
v
o
l
v
i
n
g
a
k
n
i
f
e
o
r
s
h
a
r
p
i
n
s
t
r
u
m
e
n
t
h
a
v
e
i
n
c
r
e
a
s
e
d
a
g
a
i
n
i
n
t
h
e
l
a
s
t
y
e
a
r
f
o
l
l
o
w
i
n
g
p
r
e
v
i
o
u
s
r
e
d
u
c
t
i
o
n
s
(
s
e
l
e
c
t
e
d
o
f
f
e
n
c
e
t
y
p
e
s
f
r
o
m
P
o
l
i
c
e
R
e
c
o
r
d
e
d
c
r
i
m
e
)
R
i
s
e
s
i
n
o
f
f
e
n
c
e
s
i
n
v
o
l
v
i
n
g
f
i
r
e
a
r
m
s
c
o
n
t
i
n
u
e
d
•
20% increase in handgun offences accounted for a large proportion of
the increase
•
Offences remain substantially below those seen a decade ago (31%
fewer offences than year ending March 2007)
Offences involving
firearms recorded by
police increased by 20%
to 6,694 offences (a rise
of around 1,100 offences)
Continues upward trend
seen in last few years
T
r
e
n
d
s
i
n
p
o
l
i
c
e
r
e
c
o
r
d
e
d
c
r
i
m
e
i
n
E
n
g
l
a
n
d
a
n
d
W
a
l
e
s
i
n
v
o
l
v
i
n
g
t
h
e
u
s
e
o
f
f
i
r
e
a
r
m
s
,
y
e
a
r
e
n
d
i
n
g
M
a
r
c
h
2
0
0
3
t
o
y
e
a
r
e
n
d
i
n
g
S
e
p
t
e
m
b
e
r
2
0
1
7
•
The quality of recording of homicides is thought to have remained consistently
good over time.
•
685 homicides in the latest year; 4 fewer than the previous year.
•
Recent trends are affected by incidents involving multiple victims. The previous
year was a high figure due to 96 cases of manslaughter being recorded following
events at Hillsborough in 1989. The latest year is also high due to terrorist
attacks in London and Manchester which resulted in 35 homicides being
recorded.
•
Excluding these crimes from each year there were 57 more homicides than the
previous year, a 10% rise up to a total of 650.
•
Homicide rate has fallen over the last decade
•
14 homicides per million people - year ending March 2007
•
11 homicides per million people - year ending September 2017 (excluding London
and Manchester attacks)
H
o
m
i
c
i
d
e
L
o
n
g
t
e
r
m
f
a
l
l
s
i
n
t
h
e
f
t
CSEW estimated
3.4 million theft
offences – no
change from
previous year
Substantial falls
over the longer
term
•
Most types of theft at similar levels to previous year
•
‘Other theft of personal property’ down 21%
L
a
t
e
s
t
e
s
t
i
m
a
t
e
s
s
h
o
w
n
o
c
h
a
n
g
e
i
n
t
h
e
f
t
o
f
f
e
n
c
e
s
m
e
a
s
u
r
e
d
b
y
t
h
e
C
r
i
m
e
S
u
r
v
e
y
f
o
r
E
n
g
l
a
n
d
a
n
d
W
a
l
e
s
,
f
o
l
l
o
w
i
n
g
l
o
n
g
-
t
e
r
m
d
e
c
l
i
n
e
s
o
v
e
r
t
h
e
l
a
s
t
t
w
o
d
e
c
a
d
e
s
.
R
e
c
e
n
t
r
i
s
e
s
i
n
s
o
m
e
t
y
p
e
s
o
f
t
h
e
f
t
•
Police recorded crime figures indicate genuine rises in vehicle-
related theft offences and in burglary.
•
These are crime types that are relatively well reported by the
public and relatively well recorded by the police.
•
Vehicle offences – up 18% (to 443,577 offences)
•
Burglary – up 8% (to 433,110 offences)
•
Robbery – up 29% (to 68,968 offences)
•
For well recorded crime types these police figures can provide
earlier indications of short term / emerging trends.
•
CSEW shows some signs that increases in vehicle-related thefts
are beginning to appear in the latest estimates. Further changes
are expected to feed through into future CSEW estimates.
T
r
e
n
d
s
i
n
c
r
i
m
e
b
e
i
n
g
h
a
n
d
l
e
d
b
y
t
h
e
p
o
l
i
c
e
•
For many crime types police recorded crime figures do not provide a
reliable measure of crime trends
•
However , these figure do provide an indication of police workload in
responding to crime-related demands, and downstream workload for
the CJS.
•
Rises seen over recent years are thought to reflect a combination of
factors which vary for different individual crime types. The factors can
include continuing improvements to recording processes and practices,
more victims reporting crime, or genuine increases in crime. Recording
improvement, while spanning a broad range of crime types, is thought
have been particularly pronounced in sexual offence and lower-harm
violent crime. The impact of victim willingness to report offences is also
thought to be most evident in these offence types, and particularly in
violent crime related to domestic abuse.
•
Violence against the person – up 20%
•
Domestic abuse-related offences – up 11%
•
Sexual offences recorded by the police – up 23%
M
a
i
n
p
o
i
n
t
s
•
Latest figures indicate that crime continued to fall compared with the
previous year
•
However, trends vary for different forms of crime
•
Many of the most frequently occurring crimes were at levels similar
to the previous year or fell, including fraud, criminal damage and
most types of theft and violent crime
•
Evidence of increases in some of the less frequently occurring, but
higher harm offences such as knife and gun crime. Also evidence of
rises in some types of property crime; in particular, vehicle-related
theft and burglary.
•
These rises were relatively low in volume and were more than offset
by falls seen across other higher volume offence types shown by the
CSEW.
Two main sources:
•
Crime Survey for England and Wales (CSEW)
•
Face-to-face victimisation survey on experiences of crime
•
35,000 households
•
Includes crimes not recorded by the police
•
Police recorded crime
•
Crimes recorded by 44 police forces
•
Excludes crimes that don’t come to the attention of police
•
Broader range of crimes (e.g. against business)
D
a
t
a
s
o
u
r
c
e
s
•
Crime Survey for England and Wales
(CSEW)
•
Best measure of trends in crime experienced by the general
population for most offence types
•
Good measure of frequently occurring crime types; less good
at measuring lower-volume crimes
•
Good at long-term trends; less good at identifying emerging or
short term trends
•
Police recorded crime
•
For some types of crime not a reliable measure
•
Can be affected by varying policing priorities, activity and
changes in crime recording practices.
•
Can be a useful supplement to the CSEW and provide insight
in areas the survey does not cover well – low volume crimes
and emerging or short term trends.
D
a
t
a
s
o
u
r
c
e
s
This event discussed various financing strategies for REDD+ initiatives, including mapping existing financial streams, identifying gaps and opportunities in funding, and leveraging international and domestic sources. Key points highlighted the importance of cost analysis, resource coordination, and partnership building to drive successful implementation. The event also emphasized the role of public and private sector collaboration in mobilizing resources for sustainable forest management and climate action.

Download Presentation

Please find below an Image/Link to download the presentation.
The content on the website is provided AS IS for your information and personal use only. It may not be sold, licensed, or shared on other websites without obtaining consent from the author.If you encounter any issues during the download, it is possible that the publisher has removed the file from their server.
You are allowed to download the files provided on this website for personal or commercial use, subject to the condition that they are used lawfully. All files are the property of their respective owners.
The content on the website is provided AS IS for your information and personal use only. It may not be sold, licensed, or shared on other websites without obtaining consent from the author.
E N D
Presentation Transcript
Crime in England and Wales Year ending September 2017 These are summary briefing slides For full interpretation, commentary and detailed definitions see the statistical bulletin and associated data tables
Overview of the latest crime statistics Latest figures indicate that crime continued to fall compared with the previous year However, trends vary for different forms of crime Many of the most frequently occurring crimes were at levels similar to the previous year or fell, including fraud, criminal damage and most types of theft and violent crime Evidence of increases in some of the less frequently occurring, but higher harm offences such as knife and gun crime. Also evidence of rises in some types of property crime; in particular, vehicle-related theft and burglary. These rises were relatively low in volume and were more than offset by falls seen across other higher volume offence types shown by the CSEW.
Falls in crime since the mid 1990s Crime estimated by the survey has fallen considerably from the peak levels seen in 1995. England and Wales, year ending December 1981 to year ending September 2017 Latest estimates show around 2 in 10 adults were victims of crime compared with 4 in 10 adults in 1995 (even though the latter estimate excludes fraud and computer misuse)
CSEW Fraud and computer misuse First year-on-year comparisons show 15% fall Cover offences against the general population, and exclude those against businesses and cyber attacks on organisations such as the ransomware attack which struck the NHS and other organisations in May 2017. Fraud down 10% from 3.6m to 3.2m offences Consumer and retail fraud down 20% (to 0.7 million) Bank and credit account fraud no change (2.4 million) Computer misuse down 24% from 2m to 1.5m offences Computer viruses down 26% (to 1 million) Unauthorised access to personal information down 19% (to 0.5 million)
Long-term fall in violent crime Trends in Crime Survey for England and Wales violence, year ending December 1981 to year ending September 2017 Latest estimate: 1.2 million incidents No significant change from previous year Continuation of year-on-year changes not being statistically significant But cumulative effect of non-significant changes each year is a significant decrease of 29% compared with yr end March 2013 Latest survey year = 2 in every 100 adults were a victim 1995 = 5 in 100 adults
Rises in offences involving knives continued Offences involving a knife or sharp instrument have increased again in the last year following previous reductions (selected offence types from Police Recorded crime) Offences involving knives recorded by the police increased by 21% (a rise of around 6,500 offences, up to 37,443) Number of offences (thousands) Selected knife crime offences Selected knife crime offences - year ending September 2017 40 35 30 25 20 15 10 Follows increases seen over the last 3 years 5 - 2011 2012 2013 2014 2015 Yr end Sep 2016 Yr end Sep 2017 Year ending March Highest volume recorded since 2011 when comparable records began Some recording improvements but also some genuine increases. Hospital admissions data for England showed a 7% increase in admissions for assault by a sharp object ending March 2017.
Rises in offences involving firearms continued Trends in police recorded crime in England and Wales involving the use of firearms, year ending March 2003 to year ending September 2017 Offences involving firearms recorded by police increased by 20% to 6,694 offences (a rise of around 1,100 offences) Firearm offences Firearm offences - years ending September Number of offences 12,000 10,000 8,000 6,000 Continues upward trend seen in last few years 4,000 2,000 0 2003 2004 2005 2006 2007 2008 2009 2010 2011 2012 2013 2014 2015 Year end Sep 2016 Year end Sep 2017 Year ending March 20% increase in handgun offences accounted for a large proportion of the increase Offences remain substantially below those seen a decade ago (31% fewer offences than year ending March 2007)
Homicide The quality of recording of homicides is thought to have remained consistently good over time. 685 homicides in the latest year; 4 fewer than the previous year. Recent trends are affected by incidents involving multiple victims. The previous year was a high figure due to 96 cases of manslaughter being recorded following events at Hillsborough in 1989. The latest year is also high due to terrorist attacks in London and Manchester which resulted in 35 homicides being recorded. Excluding these crimes from each year there were 57 more homicides than the previous year, a 10% rise up to a total of 650. Homicide rate has fallen over the last decade 14 homicides per million people - year ending March 2007 11 homicides per million people - year ending September 2017 (excluding London and Manchester attacks)
Long term falls in theft Latest estimates show no change in theft offences measured by the Crime Survey for England and Wales, following long-term declines over the last two decades. CSEW estimated 3.4 million theft offences no change from previous year CSEW theft offences Number of offences (thousands) 14,000 13,000 12,000 11,000 10,000 9,000 8,000 7,000 6,000 Substantial falls over the longer term 5,000 4,000 3,000 2,000 1,000 0 1981 1983 1985 1987 1989 1991 1993 1995 1997 2001 2003 2005 2007 2009 2011 2013 2015 Yr end Sep '16 Yr end Sep '17 Most types of theft at similar levels to previous year Other theft of personal property down 21%
Recent rises in some types of theft Police recorded crime figures indicate genuine rises in vehicle- related theft offences and in burglary. These are crime types that are relatively well reported by the public and relatively well recorded by the police. Vehicle offences up 18% (to 443,577 offences) Burglary up 8% (to 433,110 offences) Robbery up 29% (to 68,968 offences) For well recorded crime types these police figures can provide earlier indications of short term / emerging trends. CSEW shows some signs that increases in vehicle-related thefts are beginning to appear in the latest estimates. Further changes are expected to feed through into future CSEW estimates.
Trends in crime being handled by the police For many crime types police recorded crime figures do not provide a reliable measure of crime trends However , these figure do provide an indication of police workload in responding to crime-related demands, and downstream workload for the CJS. Rises seen over recent years are thought to reflect a combination of factors which vary for different individual crime types. The factors can include continuing improvements to recording processes and practices, more victims reporting crime, or genuine increases in crime. Recording improvement, while spanning a broad range of crime types, is thought have been particularly pronounced in sexual offence and lower-harm violent crime. The impact of victim willingness to report offences is also thought to be most evident in these offence types, and particularly in violent crime related to domestic abuse. Violence against the person up 20% Domestic abuse-related offences up 11% Sexual offences recorded by the police up 23%
Main points Latest figures indicate that crime continued to fall compared with the previous year However, trends vary for different forms of crime Many of the most frequently occurring crimes were at levels similar to the previous year or fell, including fraud, criminal damage and most types of theft and violent crime Evidence of increases in some of the less frequently occurring, but higher harm offences such as knife and gun crime. Also evidence of rises in some types of property crime; in particular, vehicle-related theft and burglary. These rises were relatively low in volume and were more than offset by falls seen across other higher volume offence types shown by the CSEW.
Data sources Two main sources: Crime Survey for England and Wales (CSEW) Face-to-face victimisation survey on experiences of crime 35,000 households Includes crimes not recorded by the police Police recorded crime Crimes recorded by 44 police forces Excludes crimes that don t come to the attention of police Broader range of crimes (e.g. against business)
Data sources Crime Survey for England and Wales (CSEW) Best measure of trends in crime experienced by the general population for most offence types Good measure of frequently occurring crime types; less good at measuring lower-volume crimes Good at long-term trends; less good at identifying emerging or short term trends Police recorded crime For some types of crime not a reliable measure Can be affected by varying policing priorities, activity and changes in crime recording practices. Can be a useful supplement to the CSEW and provide insight in areas the survey does not cover well low volume crimes and emerging or short term trends.