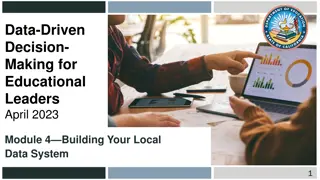
Enhancing Education Through Data-Driven Strategies
Utilizing a comprehensive approach to education, this initiative focuses on improving literacy, numeracy, and overall student well-being. Through tracking and monitoring data, assessing student progress, and involving parents and staff, the program aims to close the attainment gap and enhance learning outcomes. The role of the PEF Coordinator is vital in assessing, analyzing, identifying, and monitoring success. With a strong emphasis on data literacy and effective resource allocation, the initiative seeks to achieve excellence and equity in education.
Download Presentation

Please find below an Image/Link to download the presentation.
The content on the website is provided AS IS for your information and personal use only. It may not be sold, licensed, or shared on other websites without obtaining consent from the author.If you encounter any issues during the download, it is possible that the publisher has removed the file from their server.
You are allowed to download the files provided on this website for personal or commercial use, subject to the condition that they are used lawfully. All files are the property of their respective owners.
The content on the website is provided AS IS for your information and personal use only. It may not be sold, licensed, or shared on other websites without obtaining consent from the author.
E N D
Presentation Transcript
Context : FME and SIMD 1&2 32% 55, 200 31.5 % in SIMD 1
School Vision We create We Challenge We Care
Consultation Staff Pupils Extra help with Literacy and Numeracy More small group teaching. Helping parents to help pupils. Staff sharing good ideas and resources. Support with managing feelings . Target Literacy and Numeracy Co-ordinate Assessment and Analysis Support Data Management Build Staff Capacity Expand and Enhance HWB provision
Consultation :Parents 100% 90% 80% 70% 60% 50% 40% 30% 20% 10% 0%
Consensus Assessment and Analysis Literacy and Numeracy Professional Learning Health and Well-being PEF Coordinator to be appointed to facilitate and oversee interventions.
PEF Co-Ordinator Role A.A.I.M.S to close the attainment gap Assess Analyse Identify Monitor Success
Assessment and Analysis
Tracking and Monitoring Data The Robust Database Data gathered on children s progress is essential to achieving excellence and equity. Scottish Government, 2018 National Improvement Framework and Improvement Plan for Scottish Education. Improving data literacy to support more effective planning to achieve improvements in learner outcomes and ensuring the substantive resources being made available through the Scottish Attainment Challenge (SAC) and the Pupil Equity Fund (PEF) are used effectively to close the attainment gap. Scottish Government, 2018 National Improvement Framework and Improvement Plan for Scottish Education.
Literacy Assessment Analysis (March 2017) Reading Assessment Analysis (March 2017) 80% 80% 77% 80% 73% 71% 70% 64% 60% 53% 50% 50% 47% 50% 40% 36% 29% 27% 30% 23% 20% 20% 20% 10% 0% 12 P1 P2 P3 P4 P5 P6 P7 Total Percentage of Children Scoring at or above their Reading Age Percentage of Children Scoring below their Reading Age
Is poverty a factor in our attainment gap for Reading? Children receiving FSM achieving and not achieving expected Levels in P1 - P7 Chidlren with SIMD 1 and 2 achieving and not acheiving expected Levels in P1 - P7 120% 80% 73% 100% 100% 67% 70% 63% 86% 60% 57% 60% 56% 80% 52% 50% 69% 48% 50% 63% 44% 50% 43% 50% 57% 50% 40% 60% 38% 50% 40% 50% 50% 50% 33% 43% 27% 37% 30% 40% 31% 20% 20% 14% 10% 0% 0% 0% 1 2 3 4 5 6 7 8 9 1 2 3 4 5 6 7 8 9 Percentage of children not achieving expected levels in SIMD 1 & 2 Percentage of children on FSM not on track to achieve expected levels Percentage of children on FSM on track to achieve expected levels Percentage of children on track to achieve expected levels in SIMD 1 & 2
Mathematics Assessment Analysis (March 2017) Mathematics Assessment Results 2017 100% 92% 90% 81% 80% 80% 70% 64% 60% 55% 60% 53% 53% 47% 47% 45% 50% 40% 36% 40% 30% 20% 19% 20% 8% 10% 0% 1 2 3 4 5 6 7 8 9 Percentage of Children Scoring at or above their Mathematical Age Percentage of Children Scoring below their Mathematical Age
Is poverty a factor in our attainment gap for Mathematics? Is poverty a main factor in our Mathematics attainment gap? Mathematical Assessment Results based on FSM Mathematical Assessment Results on SIMD 1 and 2 60% 60% 70% 63% 50% 60% 44% 43% 50% 50% 50% 40% 43% 40% 29% 37% 40% 30% 25% 25% 21% 30% 25% 20% 22% 13% 20% 10% 10% 0% P1 P2 P3 P4 P5 P6 P7 Total 0% Percentage of children with SIMD 1 and 2 of total number not on track. P1 P2 P3 P4 P5 P6 P7 Total Percentage of children on FSM not on track to reach expected levels Percentage of children with SIMD 1 and 2 of total number on track to achieve
Identifying children and intervention method
Literacy Programme Staff training on literacy programme Further in depth assessment process Clear gap and individual targets identified Provided Reading Resources Book Banding List One to one Reading Sessions Two Reading Sessions per week Parents invited to a Find out more Teachers and Support Assistants professional dialogue
Impact of Literacy Programme Percentage of P4 Literacy Group on track to achieving expected targets after a 3 month intervention period. Children have increase engagement and enjoyment in Reading activities. Improved staff confidence in assessment and identifying development targets Increased skills in professional judgement Building on existing Parental Involvement 36% 64% On track Not on track Increased attainment: 9 out of the 14 children are on track to achieve Average Reading Comprehension Age gain of 1 year and 4 months 7 children completed the Literacy Programme and their one to one sessions.
Monitoring and Next Steps Monitoring the 5 key areas contributing to Raising Attainment Attendance Late Coming Participation Behaviour Inclusion
Impact and Success Percentage of targeted children on track to achieve expected Reading levels Percentage of targeted children on track to achieve expected Maths levels 100% 90% 89% 80% 90% 80% 73% 70% 80% 70% 64% 70% 61% 61% 60% 70% 57% 57% 60% 61% 60% 60% 53% 60% 55% 50% 47% 50% 45% 43% 43% 42% 38% 38% 40% 38% 38% 33% 33% 40% 33% 30% 30% 20% 20% 10% 10% 0% 0% Term 3 Term 4 Term 3 Term 4 Term 3 Term 4 Term 3 Term 4 Term 3 Term 4 Term 3 Term 4 Term 3 Term 4 Term 3 Term 4 Term 3 Term 4 Term 3 Term 4 Term 3 Term 4 Term 3 Term 4 Term 3 Term 4 Term 3 Term 4 Term 2 Term 2 Term 2 Term 2 Term 2 Term 2 Term 2 Term 2 Term 2 Term 2 Term 2 Term 2 Term 2 Term 2 P1 P2 P3 P4 P5 P6 P7 P1 P2 P3 P4 P5 P6 P7
Engaging in staff development
Build Capacity Responsive Leadership
Give Us A Break Before I joined Give us a break I felt sad and thought about upsetting things a lot. I was worrying about small things too. Now I feel happy and relaxed P5 As the course progress it is rewarding to see the children become more confident in their ability to open up individually and also offer support to other group members. At the beginning of each session we do some relaxation, it makes me calm and able to gather my thoughts P6 Coming to Give us a break takes the weight off my shoulder and I can talk about how I m feeling. It makes it easier to talk about difficult things. p5 Give us a break has given the children the opportunity to explore how they feel about their situations and think about possible solution to move forwards
Next Steps Internal HWB Forum Continue to build capacity
Wee Worry Workshop Before we can really learn, we need to feel safe, happy & healthy.
Achieving Support and guidance in learning - boosting skills confidence & self-esteem Included Getting help and guidance to overcome inequalities; full members of the communities in which they live and learn
Quality Indicators- HGIOS Successes and Achievements Learning Provision 2.4 Personalised support 3.1 Ensuring wellbeing, equality and inclusion Wellbeing Fulfilment of statutory duties Inclusion and equality Universal support Targeted support Removal of potential barriers to learning Image result for Hgios quality indicator
We come and tell our emotions and see other emotions we might feel one day Experience and Outcome I understand that there are people I can talk to and that there are a number of ways in which I can gain access to practical and emotional support to help me and others in a range of circumstances. HWB 0-03a / HWB 1-03a Our Aim To provide children with the skills and ability to recognise and discuss different emotions which they may feel within their lives in different social situations To provide copying strategies in order to limit stress and anxiety within different situation (classroom, playground and wider world context) To provide an accessible support network for children to be able to talk confidently about their worries, concerns and emotions.
Quality Indicator 2.4 Personalised Support 3.1 Ensuring wellbeing, equality and inclusion I enjoy being able to use the puppets to model to the children how to discuss our own feelings. I ensure I select a different emotion each week to model and demonstrate Teacher Miss Beatts Experience and Outcome I am aware of and able to express my feelings and am developing the ability to talk about them. HWB 0-01a / HWB 1-01a At welcome time I say how I feel and why. I like to use the puppets to talk Impact on Learners Children have the opportunity to listen and explore different feelings Children are encouraged to explore times where they can relate to the emotion characters. Encourages children to express how they are feeling. Element of choice included in learning experiences (Stones or puppets- encourages discussion) Encourages children to reflect and explore their emotions at the time and throughout the day
Impact: Pupils and Staff Miss Beatts helped me to learn to how to take turns on our trip P2 Made me feel better about things in school and in the playground P3 You learn how to sort some of your worries P4


