Enhancing Budget Standards for Low-Paid and Unemployed Australians
This project led by Peter Saunders and Megan Bedford from the Social Policy Research Centre at the University of New South Wales aims to develop updated budget standards for low-paid and unemployed Australians. By incorporating expert opinions, behavioral evidence, and individual perspectives, the project seeks to provide insights for setting minimum wages and income support to ensure a healthy standard of living aligned with community expectations.
Download Presentation

Please find below an Image/Link to download the presentation.
The content on the website is provided AS IS for your information and personal use only. It may not be sold, licensed, or shared on other websites without obtaining consent from the author.If you encounter any issues during the download, it is possible that the publisher has removed the file from their server.
You are allowed to download the files provided on this website for personal or commercial use, subject to the condition that they are used lawfully. All files are the property of their respective owners.
The content on the website is provided AS IS for your information and personal use only. It may not be sold, licensed, or shared on other websites without obtaining consent from the author.
E N D
Presentation Transcript
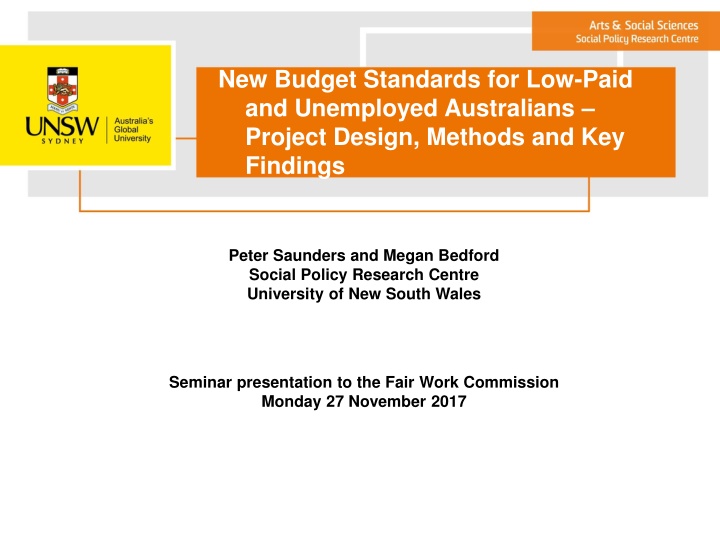
New Budget Standards for Low-Paid and Unemployed Australians Project Design, Methods and Key Findings Peter Saunders and Megan Bedford Social Policy Research Centre University of New South Wales Seminar presentation to the Fair Work Commission Monday 27 November 2017
Project Description and Objectives A budget standard represents what a particular household, living in a particular place at a particular time, needs to attain (and sustain) a specific standard of living. The method used to develop the standards involve identifying needs and costing what is required to fulfil them in a way that is grounded in actual experience. This project will build on previous Australian and recent international research to develop a set of budget standards for low-paid and unemployed Australians and their families. The approach will incorporate expert judgements and behavioural evidence, and give emphasis to the views of relevant individuals to ensure that the standards are grounded in everyday experience and reflect real needs. The results will be used to inform debate and guide decisions about the levels of minimum wages and income support payments required to support healthy living consistent with individual needs and community expectations
Background and Context Budget standards have enduring appeal because they are consistent with a common understanding of how to estimate how much is needed to achieve a specific standard of living Updates of the earlier SPRC budget standards have been used to guide the setting of the pension, foster care allowances, the minimum wage and superannuation benefits but they are now over two decades old and out of date! Uprating by the CPI takes no account of changes in prevailing community standards and other factors that influence how a budget standard is developed Budget standards research has been evolving rapidly: The UK Minimum Income Standard (MIS) is updated annually and used to evaluate the impact of social policy (see www.minimumincomestandard.org) The European Commission has funded a major project on developing a common methodology for Reference Budgets in EU countries (see paper by Goedem et al. in The European Journal of Social Security, 2015) Australian budget standards research is outdated and has not incorporated these recent developments
What is a Budget Standard? A budget standard indicates how much money a family living in a particular place at a particular time needs to purchase the material goods and participate in the activities required to achieve and sustain a particular standard of living The budgets are derived by specifying the standard and then identifying all of the items required to reach it, pricing each item and calculating the total weekly cost of the basket of items The budget standards draw on three kinds of data: expert (normative) data that reflects prevailing judgements on how much is needed to achieve specific standards; behavioural (survey) data that describes the spending patterns of actual families; and experiential (focus group) data that captures how real families budget and make ends meet. Budget standards are generally used to estimate the income levels required to achieve a minimally adequate standard of living a level below which no one should be allowed to fall They have a long history in Australia, stretching back to when Justice Higgins used them to underpin the basic wage levels set in the 1907 Harvester Judgement Only a budget standards approach can establish not only whether a particular provision is adequate or not, but also the size of any shortfall (or excess)
Key General Features of the Project A 3-year ARC Linkage project with Partner Organisations Catholic Social Services Australia (CSSA), United Voice - National Office (UV) and ACOSS, guided by a Project Reference Group with PO contacts and three independent experts Starting point was the original low cost SPRC budgets, developed and priced in February 1997, revised to reflect new research methods, availability of new data and two decades of practical hands-on experience (and criticism!) The methodology employs three kinds of data (normative; behavioural; experiential) derived from three main sources (experts; social surveys; focus groups) Unlike in the UK (but similar to the recent EU study) the focus group content has not been given a greater role or been more deliberative The key debate is over their role should it be in decision-making or validating? In the UK the approach moved from one where the experts designed the budget that was validated by focus groups, to one whereby the focus groups design and decide and the experts validate (Vranken, EU Synthesis Report, 2010) New budgets have been developed for single people, sole parent families and couples with and without children with one adult who is either in low-paid work or unemployed Project Report (and a shorter Summary Report) were released in August 2017. They are available at: https://www.sprc.unsw.edu.au/research/projects/a-new-healthy-living-minimum- income-standard-for-low-paid-and-unemployed-australians/
Some Key Differences from Earlier Study Specification of the underlying standard replacement of the Modest but Adequate (MBA) & Low Cost (LC) standards by the Minimum Income for Healthy Living (MIHL) standard (drawn from the UK public health literature) From hypothetical to representative families (implies greater reliance on behavioural approach) The role of the focus groups was constrained by the difficulties encountered in recruiting low-paid workers Budgets were derived first for low-wage families and then modified to suit unemployed families The main budget areas were changed slightly to maintain consistency with the ABS expenditure categories Housing costs were calculated separately and added on to the non-housing budgets later (to produce the grossed-up budgets) The grossed-up budgets were varied several times to ensure consistency with external evidence about the relative circumstances of different families this was a time-consuming process because it often required several steps to achieve appropriate horizontal (between- families) and vertical (low-paid vs. unemployed) relativities. (Obtaining retrospective price and other data was often difficult) Errors/incomplete documentation of the earlier study had to be identified and corrected
Family Types Low-paid working families Unemployed families W1 Single person (female,35; male,40) U1 Single person (female,35; male,40) W2 Couple (M,40 & F,35) without children U2 Couple (M,40 & F,35) without children W3 Couple as above with girl,6 U3 Couple as above with girl,6 W4 Couple as above with girl, 6 and boy, 10 U4 Couple as above with girl,6 and boy,10 W5 Sole parent (F,35) with girl,6 U5 Sole parent (F,35) with girl,6
Some Key Practical Issues Difficulty encountered recruiting for focus groups Setting item lifetimes Importance of the assumptions underlying child care costs Inclusion of a car? Variation in housing costs Drawing on past experience to revise the previous budgets Finalising the new budgets: achieving external validity and internal consistency Moving from the low-paid to the unemployed budgets involved a combination of: removing items; lowering item quality; cutting costs (e.g. by extending lifetimes and/or increased reliance on Home-brand items); reducing frequencies but budgets still had to be consistent with the MIHL standard
Setting Dwelling Types and Location Low-paid working families Family type Unemployed families Single person 1BRU, (LQ+M)/2, AMCC 1BRU, LQ, AOCC Couple without children 2BRU, (LQ+M)/2, AMCC 2BRU, LQ, AOCC Couple as above with girl, 6 2BRU, (LQ+M)/2, AMCC 2BRU, LQ, AOCC Couple as above with girl, 6 and boy, 10 3BRH, (LQ+M)/2, AMCC 3BRH, LQ, AOCC Sole parent with girl, 6 2BRU, (LQ+M)/2, AMCC 2BRU, LQ, AOCC Notes: 1/2/3BRU = 1/2/3 bedroom unit; 3 BRH = 3 bedroom house; LQ = lower quartile rent; M = median rent; AMCC =Average for middle suburbs in Sydney, Brisbane and Melbourne; AOCC = Average for outer suburbs in Sydney, Brisbane and Melbourne.
Average Rents for Assigned Dwellings Average rents in: Sydney, Brisbane & Melbourne Standard / Dwelling Type Sydney Canberra Brisbane Adelaide Hobart Melbourne All 6 capitals Low-paid families: 1BRU,(LQ+M)/2, Middle 420 275 270 200 175 257.5 315.8 266.3 2BRU, (LQ+M)/2,Middle 452.5 351.8 360 265 231.5 365 392.5 337.6 3BRH, (LQ+M)/2, Middle 532.5 442.5 400 355 312.5 440 457.5 413.8 Unemployed families: 1BRU, LQ, Outer 280 250 180 141 135 210 223.3 199.3 2BRU, LQ, Outer 350 350 260 230 276 280 296.7 291 3BRH, LQ, Outer 400 390 300 270 284 320 340 327.3 Source: Real Estate Market Facts, March Quarter 2016, Tables 9, 10, 13, 14, 21, 22, 25, 26, 29, 30, 33 & 34.
The New Low-Paid Budget Standards ($ per week, June 2016) Note: SF = single female; SM = single male; CPL = couple; CPL+1 = couple plus 6 year old girl; CPL+2 = couple plus 6 year old girl and 10 year old boy; SP+1 = sole parent plus 6 year old girl
The New Unemployed Budget Standards ($ per week, June 2016) Note: SF = single female; SM = single male; CPL = couple; CPL+1 = couple plus 6 year old girl; CPL+2 = couple plus 6 year old girl and 10 year old boy; SP+1 = sole parent plus 6 year old girl
Estimated Costs of Children ($ per week, June 2016) Family Type Low-Paid Unemployed Couple with no children 833.24 660.25 Couple with 6 year-old girl 969.90 766.74 Difference 136.66 106.49 Couple with 6 year-old girl 969.90 766.74 Couple with 6 year-old girl and 10 year-old boy 1173.38 940.37 Difference 203.48 173.63 Couple with no children 833.24 660.25 Couple with 6 year-old girl and 10 year-old boy 1173.38 940.37 Difference 340.14 280.12 Difference per child 170.07 140.06
Implied Horizontal and Vertical Relativities ($/week, June 2016) Low-paid budget relativities (1) Unemployed budget relativities (2) Family relativities (2) /(1) Family type (OECD modified and SQ(N) relativities in brackets) Single adult (1.00/1.00) 597.3 (1.00) 433.7 (1.00) 0.73 Couple (1.50/1.41) 833.2 (1.39) 660.3 (1.52) 0.79 Couple + girl, 6 (1.80/1.73) 969.9 (1.62) 766.7 (1.77) 0.79 Couple + girl, 6 & boy, 10 (2.10/2.00) 1173.4 (1.96) 940.4 (2.17) 0.80 Sole parent + girl, 6 (1.30/1.41) 827.7 (1.39) 675.2 (1.56) 0.82
Comparisons with Existing Poverty Lines ($ per week, June 2016) Henderson poverty line (head in the workforce) Poverty line set at 50% of median income (1) Low-paid grossed- up budget standard (2) Unemploye d grossed- up budget standard (3) Family type Ratio: (2)/(1) Ratio: (3)/(1) Single person Couple, no children Couple, one child Couple, two children 530.13 441.18 597.31 1.354 433.68 0.983 709.17 661.78 833.24 1.259 660.25 0.998 852.46 794.12 969.90 1.221 766.74 0.965 995.75 926.48 1,173.38 1.266 940.37 1.015 Sole parent, one child 680.59 563.43 827.70 1.469 675.18 1.198
Assessing the Adequacy of the Social Safety Net Family type Low-paid Unemployed Grossed-up Budget Standard (1) Safety net Income (2) (2) minus (1) Grossed-up Budget Standard (1) Safety net Income (2) (2) minus (1) Single adult 597.31 659.22 61.91 433.68 337.68 -96.00 Couple with no children 833.24 794.21 -39.03 660.25 552.84 -107.41 Couple with one child 969.90 978.74 8.84 766.74 708.28 -58.46 Couple with two children 1173.38 1084.64 -88.74 940.37 814.13 -126.24 Sole parent with one child 827.70 872.56 44.86 675.18 627.79 -47.39
Concluding Reflections The task of updating an existing set of budget standards has proved to be far more demanding than was originally anticipated The task would be far easier (and more valuable) if it was conducted more frequently and regularly The results indicate that existing social safety net provisions provide an adequate floor for low-paid single adults receiving the minimum wage and working full-time but not for those with a partner or children For the unemployed reliant on the Newstart Allowance, the safety net provisions fall short of the budget standards estimates by $96 for a single person and $126 for a couple with two children The average cost of a child aged between 6 and 10 years is estimated to be $170 a week at the low-paid standard and $140 a week at the unemployed standard Housing costs are the largest budget item and vary by dwelling size, but also by location: the results raise important issues about how to estimate housing costs and how the safety net system should take account of them The findings raise questions about whether a similar mechanism to that used to set and vary the minimum wage should be applied to NSA (and other social security benefits) Budget standards are not a panacea but they provide important information that can inform and assist decisions taken about adequacy at the very least, they open up debate about the meaning of adequacy, what is needed to achieve it and how the associated costs can be identified and estimated
