Efficient Data Handling in R: Tips, Tricks, and Solutions
Are you struggling with managing data in R for reporting and papers? Discover practical methods for getting data in and out of R efficiently. Explore solutions like write.csv(), clipboard integration, TableFormatter, and more. Say goodbye to manual data entry and human error issues. Enhance your workflow and save time with these helpful strategies. Don't miss out on optimizing your data management process in R.

Download Presentation

Please find below an Image/Link to download the presentation.
The content on the website is provided AS IS for your information and personal use only. It may not be sold, licensed, or shared on other websites without obtaining consent from the author.If you encounter any issues during the download, it is possible that the publisher has removed the file from their server.
You are allowed to download the files provided on this website for personal or commercial use, subject to the condition that they are used lawfully. All files are the property of their respective owners.
The content on the website is provided AS IS for your information and personal use only. It may not be sold, licensed, or shared on other websites without obtaining consent from the author.
E N D
Presentation Transcript
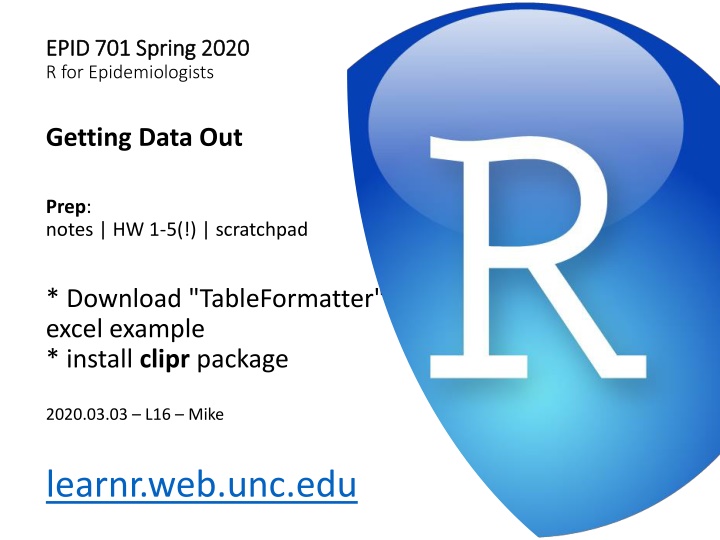
EPID 701 Spring 2020 EPID 701 Spring 2020 R for Epidemiologists Getting Data Out Prep: notes | HW 1-5(!) | scratchpad * Download "TableFormatter" excel example * install clipr package 2020.03.03 L16 Mike learnr.web.unc.edu
Data in (the only slide) Not going to focus on this much, but R can handle almost every format and connection. Check out these libraries for more. foreign sas7bdat read_xl googlesheets And did you know read.csv( url-here ) works? Often in an analysis you figure out how to read the data once but write it out over and over and over as you iterate.
Today A very practical question: How can I get data in and out of R for reporting, papers, etc.? Tricks, patterns & recipes HW5 Relevance: Tables 1 & 2, etc.
Problem Do statistical programmatic work in SAS then .hand type them in to Excel or Word tables?! This is a problem for because Super inefficient Tweaking an analysis / update? Yuck Plenty of human error problems already! Don t need to add typos to the list.
Solutions part 1 R 1. write.csv() & shell.exec() 2. write.table() clipboard 3. clipr 4. tableone() 5. markdown, etc. (later) Excel A. Basic Excel B. Fancy Excel C. Fancier Excel (w VBA)
Caveats There are many ways to do this better in R. We re only reviewing the most approachable ones today, which work if you re so-so in Excel/Word (often required for journals anyway). High bang for buck. Getting better at this (truly push-button or web- based) is probably worth the time on select projects! We ll look at other approaches with markdown and shiny later.
1. write.csv() / shell.exec() It s pretty much that easy. Let s try. Got Mac? This is not system independent since we re asking something of the operating system. system(paste("open", filename)) https://stackoverflow.com/questions/12273346/syst em-independent-method-of-opening-afile
1. write.csv() / shell.exec() # An example table raceeth_tbl = births %>% group_by(raceeth_f) %>% summarise(preterm = mean(preterm_f == "preterm", na.rm=T), pnc = mean(pnc5_f == "Early PNC", na.rm=T)) #Write a csv! (note: write.csv needs row.names=F; write_csv defaults that way) raceeth_tbl %>% write_csv("births_exp_out_raceeth.csv") shell.exec("births_exp_out_raceeth.csv")
2. write.table() clipboard Often I do 1 and 2 together # Write right to the clipboard raceeth_tbl %>% write.table("clipboard", sep="\t", row.names = F) Got Mac? Maybe helpful? data <- rbind(c(1,1,2,3), c(1,1, 3, 4), c(1,4,6,7)) clip <- pipe("pbcopy", "w") write.table(data, file=clip) close(clip) https://stackoverflow.com/questions/14547069/how-to-write-from- r-to-the-clipboard-on-a-mac
3. Try out the newer clipr clipr package clipr::write_clip(raceeth_tbl) Mac users, does this work?
3. clipr/write.table/etc excel model M1: Crudepnc5_fPNC starts in first 5 mo M2: M1+smoking pnc5_fPNC starts in first 5 mo M3: M2+mage pnc5_fPNC starts in first 5 mo M4: M3+mage_sq pnc5_fPNC starts in first 5 mo M5: WnH NA M5: AA NA M5: WH NA M5: AI/ANNA M5: OtherNA term estimate std.error statistic -0.03358 0.004692 -7.15548 8.34E-13 -4.29E-02 -0.02454 -0.03235 0.004692 -6.89462 5.40E-12 -4.17E-02 -0.03214 0.004702 -6.83596 8.15E-12 -4.15E-02 -0.02308 -0.03056 0.004694 -6.51005 7.51E-11 -3.99E-02 -0.02154 -0.02353 0.006851 NA -0.0265 0.009118 NA -0.03439 0.024744 NA -0.04264 0.042582 NA -0.01644 0.009464 NA p.value X2.5.. X97.5.. -0.0233 NA NA NA NA NA -0.03696 -0.01011 -0.04438 -0.00863 -0.08289 0.014105 -0.1261 0.040819 -0.03499 0.002112 Table 2. Modeled Estimates of Effect (Risk Difference) of Early Prenatal Care on Preterm Birth1 Model M1: Crude M2: M1+smoking M3: M2+mage M4: M3+mage_sq M5: WnH M5: AA M5: WH M5: AI/AN M5: Other RD 95% CI -0.034 -0.032 -0.032 -0.031 -0.024 -0.027 -0.034 -0.043 -0.016 (-0.0429, -0.0245) (-0.0417, -0.0233) (-0.0415, -0.0231) (-0.0399, -0.0215) (-0.037, -0.0101) (-0.0444, -0.0086) (-0.0829, 0.0141) (-0.1261, 0.0408) (-0.035, 0.0021) 1 Successive models include terms from previous model. Model 5 (M5) is a race-ethnicity specific model to allow for effect measure modification of risk difference (RD).
4. tableone Takes some massaging. Still WIP. Some code to get you started: t1 = CreateTableOne(data=births) %>% print(noSpaces=T) %>% as.tibble() t1_b = CreateTableOne(data=births) %>% print(noSpaces=T) %>% as_tibble(rownames = "var") %>% separate(Overall, c("n", "%"), sep = " ") t1_b clipr::write_clip(t1_b) Also, here s how to submit a please fix this https://github.com/kaz-yos/tableone
A. Basic Excel Basic patterns for automation using R and Excel Send to clipboard and format in Excel, then re- paste values if you need to update. Meh. Send to clipboard, paste in Excel, then link values to a table you format exactly as you like. Better! Use readxl::write_excel() to plop the data frame in the range you want.
B. Fancy Excel Fancy patterns for automation using R and Excel: Use live-linked images (secret camera tool!) to keep tables up to date and easy to share in gmail, linked in powerpoints, etc.
C. Fancier Excel Use well-formatted summary output tables from R to build (basic, it s not ggplot ) graphics in Excel
C. Fancier Excel High school students % err 1 in X %: race/eth gender Middle school students M stress % err 1 in X $ %: race/eth % gender $ Topic #/30 bar W B A H F #/30 bar W B A H F M stress vs. 2015 vs. 2015 Demographics Gender Male 57 43 3.9 1 in 2 3.9 1 in 2 = 56 = 44 54 4.5 1 in 2 46 4.5 1 in 2 = 49 = 51 17/30 53 60 63 55 58 16/30 57 55 56 41 56 100 100 Female Sexual Orientation Straight 13/30 47 40 37 45 100 42 14/30 43 45 44 59 100 44 82 16 2 3.1 1 in 1 2.9 1 in 6 1.2 1 in 43 = 84 = 11 = 4 79 3.8 1 in 1 10 2.8 1 in 10 11 2.9 1 in 9 = 82 = 7 = 11 25/30 82 71 89 78 81 24/30 81 80 79 81 77 71 91 72 85 LGBT+ 5/30 17 24 8 22 14 3/30 9 10 8 10 14 25 8 17 3 Not sure Race White Non-Hispanic 1/30 1 5 4 5 3/30 10 10 13 10 9 4 1 12 11 60 12 18 5 5 4.2 1 in 2 2.8 1 in 8 3.3 1 in 6 1.9 1 in 20 1.9 1 in 19 = 60 = 15 11 = 7 = 6 54 4.8 1 in 2 12 3.1 1 in 9 18 3.7 1 in 6 6 2.3 1 in 16 10 2.9 1 in 10 = 57 = 8 = 21 = 4 = 10 18/30 43 16/30 35 100 63 57 100 51 57 Black or African American 4/30 26 4/30 36 100 11 13 100 10 11 Asian & Pac. Isl. 5/30 17 5/30 12 100 15 20 100 17 19 Hispanic or Latino/a 2/30 6 2/30 7 100 5 5 100 8 5 Multi-racial Automobile / Transportation Safety Not always wears helmet: biking 2/30 7 3/30 11 6 5 14 8 47 3.9 1 in 2 = 44 57 4.4 1 in 2 33 4.2 1 in 3 32 4.2 1 in 3 14 3.1 1 in 7 = 57 = 34 22 = 14 14/30 48 44 48 35 41 52 46 17/30 45 74 71 68 60 55 62 Not always wears helmet: roller blading NOT ASKED 10/30 28 40 37 32 33 32 33 28 12 3 21 7 3.5 1 in 4 2.5 1 in 9 2.9 1 in 29 3.2 1 in 5 2.1 1 in 14 = 29 = 16 = 5 = 17 = 8 Not always wears seatbelt: passenger 8/30 24 35 29 22 33 23 31 10/30 20 50 46 32 33 31 40 Passenger w/ drinking driver [30d] 3/30 10 18 7 13 12 11 16 4/30 13 17 17 9 17 11 24 Driver while drinking [30d] 1/30 4 6 4 NOT ASKED Text/email while driving [30d] 6/30 23 24 5 17 18 24 23 NOT ASKED Driver while marijuana use [30d] 2/30 7 11 9 6 8 10 NOT ASKED
D. Fancier Excel (just showing) Process data in R as before Use Excel drop-down selectors to navigate your output datasets and build good lookin dashboards Consider VBA to power through all options, fill tables, and dump long reports in word, pdf or powerpoint
D. Fancier Excel (VBA example) Sub PDF_Printer() Mike Dolan Fliss, 2016 Dim ws As Worksheet Dim ws_unique As Worksheet Dim DataRange As Range Dim iLastRow As Long Dim iLastRow_unique As Long Dim UniqueRng As Range Dim Cell As Range Dim LastRow As Long Dim LastColumn As Long Dim DropDown As Range printdirectorypostfix = "SAC 1 pagers" Report = " SAC 4Ps" printpage_start = 9 printpage_end = 12 'Would be better to assign directory names, sheet range printdirectorybase = "D:\User\Dropbox\Community\CounterTools-Mike Collab\Report Store" printdir = printdirectorybase & "\" & printdirectorypostfix & "\" printtype = xlTypePDF printfiletype = ".pdf" 'added so it works across workbooks Windows("CountyHealthData_v6.xlsx").Activate Set ws = Worksheets("Reports") 'Amend to reflect the sheet you wish to work with Set ws_unique = Worksheets("CT plans") 'Amend to reflect the sheet you wish to work with Set DropDown = ws.Range("B25") 'Application.ScreenUpdating = False With ws Set UniqueRng = ws_unique.Range("F3:F38") 'to F38 For Each Cell In UniqueRng DropDown.Value = Cell.Value Name = printdir & Cell.Value & Report & printfiletype ws.ExportAsFixedFormat Type:=printtype, Filename:=Name, _ Quality:=xlQualityStandard, IncludeDocProperties:=False, IgnorePrintAreas _ :=False, OpenAfterPublish:=False, From:=printpage_start, To:=printpage_end Next Cell End With Application.ScreenUpdating = True End Sub
E. Excel End Game (not demoing) Connect R and SQL Server or Excel s Power BI. Ingest R-built summary tables as linkable objects in Excel Power BI/SQL relational databases Build basic web-based or printable excel dashboards Similar workflow for Tableau rerun your R, and refresh! Or write summary tables out to google sheets. Sky s the limit.
LaTeX R can export tables in LaTeX, HTML, word, etc. Wait for knitr/markdown, coming up soon! tables package: https://cran.r-project.org/web/packages/tables/vignettes/tables.pdf knitr, stargazer, xtable: https://sachsmc.github.io/knit-git-markr-guide/knitr/knit.html https://www.jakeruss.com/cheatsheets/stargazer/ https://cran.r-project.org/web/packages/xtable/vignettes/xtableGallery.pdf kable: https://cran.r-project.org/web/packages/kableExtra/vignettes/awesome_table_in_html.html formattable / shiny: https://cran.r-project.org/web/packages/formattable/vignettes/formattable-data-frame.html

")


 / shell.exec()")
 / shell.exec()")
 → clipboard")


")
")
")