Determinants of Aid Giving: A Panel Analysis Insights
Delve into the landscape of aid giving through a comprehensive analysis of various types of aid, ranging from historical perspectives like the Marshall Plan to contemporary debates on aid effectiveness. Explore the complex dynamics of aid allocation, recipient responses, and the motivations behind aid giving, shedding light on the multifaceted aspects of international development assistance.
Download Presentation

Please find below an Image/Link to download the presentation.
The content on the website is provided AS IS for your information and personal use only. It may not be sold, licensed, or shared on other websites without obtaining consent from the author.If you encounter any issues during the download, it is possible that the publisher has removed the file from their server.
You are allowed to download the files provided on this website for personal or commercial use, subject to the condition that they are used lawfully. All files are the property of their respective owners.
The content on the website is provided AS IS for your information and personal use only. It may not be sold, licensed, or shared on other websites without obtaining consent from the author.
E N D
Presentation Transcript
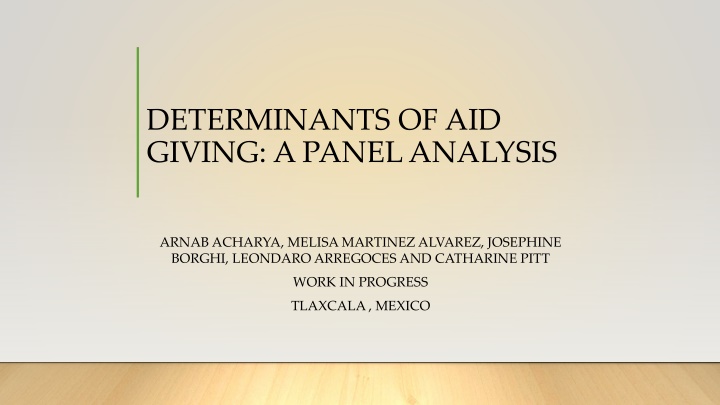
DETERMINANTS OF AID GIVING: A PANEL ANALYSIS ARNAB ACHARYA, MELISA MARTINEZ ALVAREZ, JOSEPHINE BORGHI, LEONDARO ARREGOCES AND CATHARINE PITT WORK IN PROGRESS TLAXCALA , MEXICO
THIS PRSENTATION INTRODUCTION: Aid giving in general WHY HEALTH AID? PANEL DATA DESCRIPTIVE ANALYSIS MODEL SELECTION RESULTS CONCLUSIONS
LANDSCAPE OF AID GIVING MARSHALL PLAN: Single donor to countries who previously had high industrial development (1945-1955) AID GIVING, LOW AND MIDDLE INCOME COUNTRIES (LMIC): Population issues, Big Push, Elimination of Famine and Cold War (1958-1990) POST COLD WAR: Aid giving falls to LMIC, Political stability for the ex-Soviet Block (1991-2000) HIV/AIDS, ENDOGENOUS GROWTH THEORY and the CAPABILITY APPROACH: Aid given to improve health and education, MDGs (2001 to present)
DEBATE: Growth IS AID EFFECTIVE: Does it create growth? (Easterly 2003 Bourguignon and Sundberg 2007, Rajan and Subramaniam 2009, Minoiu and Reddy 2010, Clements, Radelet and Bhavnani, 2004) ALL AID: it does not have an impact, or very little impact DISAGGREGATE AID INTO GEO-POLITICAL AND ALL OTHER TYPE: The results improve, geo-political aid does not do much, but other types of aid giving have impact DISAGGREGATE TO HUMANITARIAN, SHORT-RUN AND LONG-RUN INTENTION AID: Short run aid affects growth
DEBATE: Recipient Response FINANCING AND AID: Countries replace domestic financing with aid receipts (Pack and Pack, 1994) CAPITAL FORMATION: Not much impact (Boone, 1994) ACCOUNTABILITY AND AID: Foreign aid reduces accountability and increases dependency DAH and HEALTH FINANCING: Sectoral issues are complicated, Development assistance for health reduce or increase government spending on health (Mishra and Newhouse 2009 and Liu et al.2010).
DEBATE: Motivations, empirical work WHY AND HOW IS AID GIVEN, Does it have any intention of improving welfare or just political or bribery? (Pack and Pack, 1993; Alesina and Dollar, 2000, Knack and Rahman, 2007, Gehring, Michaelowa and Dreher, 2017, Acharya, de Lima and Moore, 2006) MOTIVATION FOR AID GIVING: Supposedly poverty alleviation and economic growth (Collier and Dollar, 1999) MODATLLITY OF AID GIVING: Are there too many aid givers for any single country and do they burden the recipient bureaucracy with too many individual projects? Herd-effect, risk, Nash, Houtthaker effect
PAPERS TOPIC MOTIVATION FOR AID GIVING: Can we determine the intention of aid giving in development assistance for health? A good question, as health aid should have no other intention than improve health, and not that hard to measure IMR, Life-Expectancy, perhaps just assist any country that is poor MODATLLITY OF AID GIVING: Giving aid for HIV/AIDS is politically popular in donor countries and UNICEF has cultural recognition, providing for child and maternal health is popular. Too many donors Paris: Development Assistance for aid should be coordinated, and fewer countries per single country
EMPIRICAL TESTING WHAT DATA TO USE? ALL AID: Aid is given for multi-purposes even poverty alleviation or related factors are the main aim poverty measures are not collected all that often in developing countries, so difficult for analysis HEALTH AID: Given for improving health, but mostly for IMR, MMR and not for adult health except HIV/AIDS, not all countries were affected by HIV/AIDS PERIOD TO COVER: Avoid the cold war period, there is a drop in all types of aid in 1990s, but picked up after George W. Bush, note the US survey, May 2017 71 percent chose the statement that when hunger is a major problem in some part of the world, we should send aid whether or not the U.S. has a security interest in that region up from 63 percent when asked in the year 2000. 2018, even with Trump, https://www.brookings.edu/wp-content/uploads/2017/08/global-20170731-blum- stevenkull-brief-6.pdf
EMPIRICAL IMPLICATIONS HYPOTHESIS: Foreign aid should be delivered so that: THOSE NEEDING AID: Those where the poorest live should receive aid, proxy measure has been GDP, measured at PPP or those with the most ill health should receive aid-HIV/AIDS, Low life-expectancy, IMR THOSE WHO MANAGE AID WELL: Perhaps those who have rule of law, efficiency raising revenue should receive aid or are democratic TOO MANY COUNTRY GIVING AID (corollary): Are countries giving aid to aid popular countries? COUNTER TO THESE: To improve voting in the UN for the donor, this may be exclusive to the US
LITERATURE REPORTS ALESINA AND DOLLAR INVESTIGATE: ??? ????? ??? 1970 94 = ??????? ?????? ????????? ??????????? ,?? ?? ????? ??????? ??? ???? ? ?????? ??????? Panel data, although 5 year average. They use OLS and try Tobit as many developing countries may not get aid. They find no need for Tobit, almost every LMIC got aid during this period, but not for specific donors WHAT MATTERS: Income, openness, Democracy etc. Other political factors such as voting in the UN
MORE FROM LITERATURE AID/GDP: is affected by poverty ratio (quadratic), population and sometime country management variable, 1994 cross country data (Collier and Dollar, 1999) MODE OF AID GIVING: Recipient countries report inefficiencies due to having too many donors
QUESTIONS! DO DONORS GIVE AID FOR THE RIGHT MOTIVES? IMR, POVERTY, RULE OF LAW WHAT CAUSES TOO MANY DONORS? IMR, POVERTY OR EMULATION DO THEY GIVE AID IN SIMILAR WAYS? ARE THERE PATTERNS TO BE OBSERVED DO GOOD DONORS HAVE SMALLER FEWER RECIPIENTS? META- ANALYSIS, NOT DONE
WHICH DATA AND WHY? DATA USED AID GIVEN SPECIFICALLY FOR REPRODUCTIVE MATERNAL AND CHILD HEALTH (RMNCH) Specializing in a sector as have been recommended FEW FIELDS TRACK DATA FOR SPECIFIC TYPE OF AID GIVING RMNCH IS GIVEN FOR SPECIFIC REASONS Motivations will be easy to determine DATA FROM 2003-2013 Beginning from the US PEPFAR, All results will be updated to 2015. Averaged over 3 years and then, 2012-13. Panel Data.
TWO MEASURES USE TWO MEASURE TO OBTAIN THE MODALITY OF AID GIVING: Hirschman-Herfindahl (HH) Measure and Theil Measure Do recipients get a lot of small donations from many donors: HH Measure, the smaller the measure more the fragmentation: 2 ? ???= ?=1 ?? Do donor give a lot of small amount to a lot of countries: Theil Measure, the smaller the measure the weaker is the concentration, Proliferation: ? ??? ???ln(??? ??=1 ???) ? ?=1
` Avg. no of donor per recipient/To tal Total yearly Aid (in Billion US$) Per-capita Aid HH-index Average Number of Recipients Theil Index Average Recipient GDP/PPP Average Recipient IMR 2003-05 20/29 4.9 2.5 0.277 117 0.162 5199 50 2006-08 22.5/33 6.65 4.19 0.305 116 0.147 5274 47 2009-11 27.15/39 8.5 6.02 0.262 115 0.110 5052 45 2012-13 25/46 10.45 6.702 0.341 112 0.142 5428 40 India PPP: 3004-5143, No. of Donor: 28-34, Per-capita Aid: 0.34 to 0.34, IMR: 57-41 Tanzania PPP: 1750-2335, No. of Donor: 28-38, Per-capita Aid: 3.44-10.52 IMR: 63-37.53
RMNCH funding in Tanzania MCH funding is a large portion of health expenditure, basket funding in place for (03-11?) decreases aid fragmentation--HH Index, PEPFAR US increase-a larger concentration Year No of Donor index Total Aid HH- Total Health Exp, per capita Aid/Exp Rev/GDP IMR 2003-05 28 0.103 3.47 18.55 19% 9% 63 2006-08 29 0.143 6.11 27.53 22% 10% 52 2009-11 34 0.211 8.64 34.17 25% 10% 43 2012-13 38 0.192 10.53 48.84 22% 12% 38
Some Donors No. of Recipients Average Per- Capita Amount Minimum Per- capita Maximum Per-capita Total 141 135 4.75 1.60 0.03800 0.00003 31.60 91.50 USA 120 0.26 0.00003 4.91 Euro 109 0.87 0.00040 11.08 GFUND 72 0.36 0.00018 1.86 GAVI 65 0.29 0.00003 4.85 UK 75 0.13 0.00001 2.38 Canada 52 0.20 0.00004 6.04 Norway Averaged over 2003-2004, 4 periods
No. of Recipient and Theil Value weighted by share of total aid 2003-05 2006-08 2 1.5 Donors and the Theil Measure: No real relation, everybody proliferates 1 .5 0 Theil 2009-11 2012-13 2 1.5 1 .5 0 0 50 100 150 0 50 100 150 No. of Recipient Graphs by Time
Mean Median Ratio Recipients get a lot of small aid and this is increasing in time. Are donors behaving like each other, in that they copy each other. .3 2003-2005 2006-2008 2009-2011 2012-2013 .2 Density .1 0 0 2 4 6 8 10 ratio mean/median kernel = epanechnikov, bandwidth = 0.5414
Motivation for Aid giving Are countries motivated by standard normative health indicators in giving maternal health:, do these factors at the recipient country level play a role? Low per-capita income High burden of ill health Country effort in health Domestic Resource Mobilization Country Governance Following the leader
Donors respond to low income, negative slope 2003-05 2006-08 2003-05 2006-08 0 2 0 -5 -2 log per-captia aid log per-capita aid -4 -10 -6 2009-11 2012-13 2009-11 2012-13 0 2 0 -5 -2 -4 -10 -6 6 8 10 12 6 8 10 12 6 8 10 12 6 8 10 12 log per-capita gdp log per-capita gdp IDA EURO UK Canada Total Global Fund US GAVI Graphs by time Graphs by time
Donors respond to IMR, positive slope 2003-05 2006-08 2003-05 2006-08 2 0 0 -2 -5 Log Per-capita Aid Log Per-capita Aid -4 -10 -6 2009-11 2012-13 2009-11 2012-13 2 0 0 -2 -5 -4 -10 -6 0 50 100 150 IMR 0 50 100 150 0 50 100 150 IMR 0 50 100 150 Total Global Fund US GAVI IDA EURO UK Canada Graphs by time Graphs by time
Sample matters: use of small countries can produce odd results 137-144 SMALL AND LARGE COUNTRIES, (SCALE 0-100) 109-113 COUNTRIES, POPULATION > 1,000,000 (SCALE 0-30) 100 30 80 20 per-captia aid per-captia aid 60 40 10 20 0 2003-05 2006-08 2009-11 2012-13 0 2003-05 2006-08 2009-11 2012-13
MODEL SELECTION MAIN QUESTION: How can we explain the amount recipients get from each donor given that the donors are motivated by, IMR, Income and that they tend act like each other. We are ruling out political motivations, so we look for improved results from proper management Behaving like other donors, Paris and Busan declaration: coordinate aid and don t give to everyone. We see little evidence of this in the last graph
PANEL DATA How much donor gives to a recipient, is clearly a moving average, persistent autocorrelation Take total average aid from donors to LMIC, ???: ???= ? + ??? 1+ ????+ ????+ ??+ ??? Some predetermined variable, and some exogenous variables, clearly the dependent variable is lagged correlated For specific donors we want to add how other countries behave
Most have considered cross country Add specific recipient characteristic: political factor such as UN voting, but many time invariant factors such being an old colony of the donor. Take care of endogeneity problem of income for Life Expectancy or IMR to run 2SLS Many just carry out OLS, as already stated
Total Aid Given, No Dynamic Panel Variable No. of donor Log IMR Dummy for 2009-13 Revenue Log Population Law Aid/Gov Budget Constant R-Square Hausman Test: Rule out Random Effect, legend: * p<0.05; ** p<0.01; *** p<0.001 Dependent Variable, log of Total Aid given to a country from all donors, OLS, all time 0.109*** 0.808*** 0.331** -0.412 0.312*** 0.292* 0.00003 6.755*** 0.691 Fixed Effect .043** -0.751 -0.036 0.848 2.654*** 0.599* 0.0005 -24.567 rho = 0.988 OLS, time 1 0.141*** 0.771*** OLS, Time 4 0.0752** 1.145*** -2.15 0.347*** -0.071 -0.0009 5.606*** 0.621 1.531 0.359** 0.305 -0.001 5.94*** 0.698
Strange Results From the fixed effect, rho very high, suggesting a lot of variations comes from the cross-section IMR most likely pre-determined by aid in general, thus first differencing does cause some problems Lagged levels are poor instruments
STATA COMMAND xtabond2 ln_tot_aid L.ln_tot_aid L.ln_imr L.count paris law if include == 1, gmm(L.(ln_tot_aid count ln_imr) ) iv( L.hexpratio L.aid_gov_bud law paris revenue lnPop ) robust lnPop revenue
Log of Total Aid to a Country (N=160) Dummy , 09-11 and 12- 13 Cons- tant lag ln IMR Log Pop Reve- nue Hanse n lag aid Count Law AR(1) Model 1 2.566** 0.701*** 0.370* 0.008 -0.143 0.099 -0.606 0.090 NO NO Model 2 2.566* 0.757*** 0.287 -0.160 0.083 -0.611 0.046 NO NO 0.167 Model 3 2.248* 0.713*** 0.423** 0.101* -0.681 0.111 Yes
Observations: Amount of Aid Two important factors population and IMR are not robust to having time a factor, the time Paris: a dummy for 09-11, and 12-13. This is the factor that reports the agreement to reduce fragmentation. Here it reflects probably the Great Recession when the number of donor rose but the amount decrease. Two factors are important in the right way: population (+) and IMR (+). But no response to revenue and rule of law We probably needed a larger series.
Log No. of Donors (N=160) Con- stant lag log Count lag ln IMR Reve- nue Dummy, 09-13 ln Top 8 Han- son log PPP log Pop law AR Model 1 1.918* 0.252* -0.07** 0.06*** -0.055 -0.066 YES YES Model 2 2.433* -0.115 -0.091 0.039 -0.149 0.100* -0.050 0.070* YES YES Model 3 0.738* 0.243 0.195** 0.065* -0.306 0.120** 0.171 YES YES - Model 4 1.15* 0.187 0.495 0.212 0.212* -0.265 -0.072 0.056* YES YES
Observations: Number of Donors Lagged dependent variable, nearly insignificant Number of donors increased after 2008, as this was an international policy. Whether to engage in giving aid may depend on how much aid is being given by bigger donors Population is positively related to number of donors
Single Donors AGGREGATION IS MISLEADING Aid giving is a single donor s decision, the amount is not given in coordination EXAMINE SINGLE DONORS There are some large donors giving over 1 billion dollars, 11 in this period, although per-capita yearly amount are small And some that are traditionally thought to be ideal aid giver and also give a large amount
SINGLE DONOR BEHAVIOR (IMR) Determinants for Aid Amount (IMR) Determinants for Aid Amount (IMR) log Population Lagged log IMR Lagged Log IMR log Population 1.5 .6 1 1 .4 1 .5 .5 .2 .5 0 0 0 -.5 -.2 -.5 0 Revenue Law Revenue Law 10 1 5 1 .5 5 .5 0 0 0 0 -.5 -5 -5 -.5 -1 -10 Euro UK Canada Norway Euro UK Canada Norway US GAVI IDA GFUND US GAVI IDA GFUND
SINGLE DONOR BEHAVIOR (PPP) Determinants for Aid Amount (PPP) Determinants for Aid Amount (PPP) Lagged log PPP/cap Log Population Log Population Lagged log PPP/cap 1.5 0 1 0 -.5 -.5 1 .5 -1 .5 -1 -1.5 0 -1.5 0 -2 Revenue Law revenue law 1.5 10 2 5 1 5 1 0 .5 0 0 -5 0 -5 -1 -10 -.5 US GAVI IDA GFUND US GAVI IDA GFUND Euro UK Canada Norway Euro UK Canada Norway
Observations Most likely Lagged PPP works as a better predictor for all donors than lagged ln PPP US aid giving seems extremely strongly motivated since 2003-2013 by IMR and PPP Not shown, these donors and many smaller donors give amounts of aid independent of each other Perhaps smaller number of recipients per donor makes the standard deviation larger! Could make proliferators look better. Or we need larger series
CONCLUSIONS WE STILL SEEM TO HAVE LARGE FRAGMENTAION AND PROLIFERATION Too Many donors, that leads to fragmentation Proliferation, doesn t really have a logical reasoning, US seems to give aid to nearly every country, causing some econometric problems DIFFERENCE BETWEEN AMOUNT AND DECISION TO GIVE AID The decision to give aid may be motivated by who the top donors give aid, small donors likely want to send signal that they complement the bigger donors The amount when looking at individual donors seem to be unrelated to the amount larger donors give
CONCLUSIONS IMPROVING THE FINDINGS Larger series is needed, up to 2015 is available now Hard to include country specific factors, perhaps certain factors such as changes in government for both donors and countries can be used, UN votes in the previous year in favor of US and NATO Add lagged Foreign Direct Investment as an independent variable Analyse larger number of donors to examine what explains the results we obtain, a meta analysis on the donors, Classifying the characteristics of good aid donors. Ranking donor
