Defining & Measuring the Middle Class by Steven Pressman
Steven Pressman from Monmouth University and Colorado State University discusses approaches to defining and measuring the middle class, citing Mollie Orshansky's contributions to poverty measurement and the challenges in accurately assessing middle-class status. The presentation also covers Orshansky's methodology in measuring poverty, the limitations of her approach, and the evolving definition of necessities over time.

Download Presentation

Please find below an Image/Link to download the presentation.
The content on the website is provided AS IS for your information and personal use only. It may not be sold, licensed, or shared on other websites without obtaining consent from the author.If you encounter any issues during the download, it is possible that the publisher has removed the file from their server.
You are allowed to download the files provided on this website for personal or commercial use, subject to the condition that they are used lawfully. All files are the property of their respective owners.
The content on the website is provided AS IS for your information and personal use only. It may not be sold, licensed, or shared on other websites without obtaining consent from the author.
E N D
Presentation Transcript
Defining & Measuring the Middle Class Steven Pressman Monmouth University and Colorado State University pressman@monmouth.edu
3 MOLLIE ORSHANSKY B.A., Hunter College, 1935, in math & statistics; graduate work at American University in economics & statistics 1939, research assistant at US Children s Bureau, worked on children s health & nutrition 1942, statistician for NYC Department of Health 1945, U.S. Department of Agriculture, working on family consumption & living standards. She soon became their Senior Food Economist, collecting & analyzing data on food consumption 1958, Social Security Administration expert on income adequacy Dec. 1962, President Kennedy asked Walter Heller, chair of CEA to get poverty statistics. 1963, developed US definition of poverty 1965, OEO adopted her measure 1969, Bureau of Budget directed all Federal agencies to use this measure to determine eligibility for federal programs
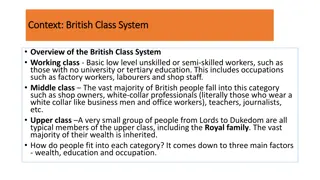
4 SOME APPROACHES TO DEFINING THE MIDDLE CLASS Percentage around median income Middle Three Income Quintiles- look at what % of total income they get Robert Putnam, Our Kids- households where no parent has a college degree but some education beyond high school Thomas Piketty, Capital in the Twenty-First Century look at wealth distribution Ask people if they are middle class & use average income of those who say they are middle class (Pew)
5 HOW ORSHANSKY MEASURED POVERTY Recognized importance of family size Used food budgets for families of different sizes (first used by DuBois in the US in the late 19th century) Costed out food budgets for families Dept. of Agriculture surveys found that households spend around 1/3 their income on food, she multiplied food budgets (for each household) by 3. US poverty rate=#poor households/#households Thresholds rise every year with inflation (CPI) 2015 POVERTY GUIDELINES FOR THE 48 CONTIGUOUS STATES AND THE DISTRICT OF COLUMBIA Persons in family/household 1 2 3 4 5 6 7 8 Note: For families/households with more than 8 persons, add $4,160 for each additional person. Source: 2015 Poverty Guidelines, U.S. Department of Health & Human Services Poverty guideline $11,770 15,930 20,090 24,250 28,410 32,570 36,730 40,890
6 PROBLEMS WITH ORSHANSKY MEASURE Based only on money income from work or market income Ignores other income (health care benefits) Ignores Taxes on income Ignores Government Benefits (Food Stamps, Medicaid, Housing Vouchers, etc.) Says nothing about assets or debt (Pressman & Scott, ROSE, June 2009) What is regarded as necessary changes over time & from place to place 100 years ago, cars, phones, computers, child care, college education and 2 cars to commute to work were not necessary Today, food multiplier 4 or 5 rather than 3. Regional Cost of Living Differences Used emergency food budget (result in 75%-80% lower poverty thresholds) rather low-cost budget
7 POSITIVE ASPECTS OF THE ORSHANSKY DEFINITION She went out & found out what was necessary for a household to survive during the year. Grounded theory Recognized importance of family size & came up with an empirical solution Recognized that location matters Recognized that inflation matters
8 WHY THE MIDDLE CLASS MATTERS ECONOMIC REASONS Their income & spending are main determinants of economic growth Productivity growth suffers POLITICAL REASONS Voting increases Aristotle (Politics, Book IV) noted that communities with a large middle class would be dominated by neither the rich nor the poor & will be better run as a result Lipset (1959) Hypothesis- a large middle class penalizes extremists & sustains democracy PSYCHOLOGICAL or HEALTH REASONS Inequality leads to stress and to health problems (Wilkinson & Pickett, 2011)
9 WHO IS MIDDLE CLASS- A 5 STEP PROGRAM Take median household income for a family of 4 (surveys and estimates of household wealth in 2010 found a middle-class income for a family of four was $68,000+, close to the median for a family of four Find median household disposable income Middle class those 4-member households with disposable income between 67% & 200% of the median (Pew Research Center) For households of other sizes, use the Orshansky adjustments & repeat. % middle class = % all households that are middle class
10 AN ADDITIONAL PROBLEM DOWNWARD MOBILITY During the Great Recession median household income fell. Households may still be counted as middle class, even after experiencing a 5% drop in disposable income, because the median also dropped.
11 LUXEMBOURG INCOME STUDY Began in 1984 Now 48 countries in LIS database Comparable definition of income & other variables Data centered around particular years, called Waves -Wave #1 centered around 1980 -Wave #8 centered around 2010 -Wave #9 centered around 2013
12 MIDDLE-CLASS INCOME LEVELS (US2013) INCOME RANGE (Household Income) HOUSEHOLD SIZE 1 $28,569-$85,281 2 $37,140-$110,865 3 $45,710-$136,449 4 $54,281-$162,033 5 $62,852-$187,617 6 $71,422-$213,201 7 $79,993-$238,786 8 $88,564-$264,370 9+ $97,135-$289,954 Source: Luxembourg Income Study Database
13 US MIDDLE CLASS OVER TIME % Middle Class 59% 57% 55% 2004, 53.5% 53% 2010, 52.2% 53.1% 2013, 51.1% 51% 51.0% 50.0% 49% 47% 45% 1970 1975 1980 1985 1990 1995 2000 2005 2010 2015 Adjusted Unadjusted
14 MIDDLE CLASS, ANGLO-SAXON COUNTRIES %Middle Class 70% 65% 60% 55% 50% 1970 1975 1980 1985 1990 1995 2000 2005 2010 US UK Canada
15 MIDDLE CLASS, NORDIC COUNTRIES %Middle Class 80% 75% 70% 65% 60% 55% 50% 1965 1970 1975 1980 1985 1990 1995 2000 2005 2010 2015 Finland Norway Sweden
16 MIDDLE CLASS, CONTINENTAL EUROPE %Middle Class 75% 70% 65% 60% 55% 50% 1970 1975 1980 1985 1990 1995 2000 2005 2010 France Germany Italy
17 MOVING FORWARD We need to control for regional difference in cost of living & expand the number of countries with measures of the middle class. We need to begin to test theories find out what it is that has caused the middle class to shrink in the US & other developed nations. Standard economic explanations (robots and trade) seem to lack empirical support. We need to understand why the middle class did not shrink in some countries (Canada, Italy and Norway) & increased in a few (France). A paper of mine on the case of Italy identifies demographics and the lack of financialization as two key factors.
Thank you for paying attention and putting up with me!!