Cost-Sensitive Loss Functions in Machine Learning
Explore the concept of cost-sensitive loss functions in machine learning, a vital aspect often overlooked by standard loss functions. Understand how underestimates and overestimates can have varying costs, impacting decision-making processes. Learn about the importance of adjusting loss functions to reflect the relative costs of errors, potentially transforming the decision-making landscape.
Download Presentation

Please find below an Image/Link to download the presentation.
The content on the website is provided AS IS for your information and personal use only. It may not be sold, licensed, or shared on other websites without obtaining consent from the author.If you encounter any issues during the download, it is possible that the publisher has removed the file from their server.
You are allowed to download the files provided on this website for personal or commercial use, subject to the condition that they are used lawfully. All files are the property of their respective owners.
The content on the website is provided AS IS for your information and personal use only. It may not be sold, licensed, or shared on other websites without obtaining consent from the author.
E N D
Presentation Transcript
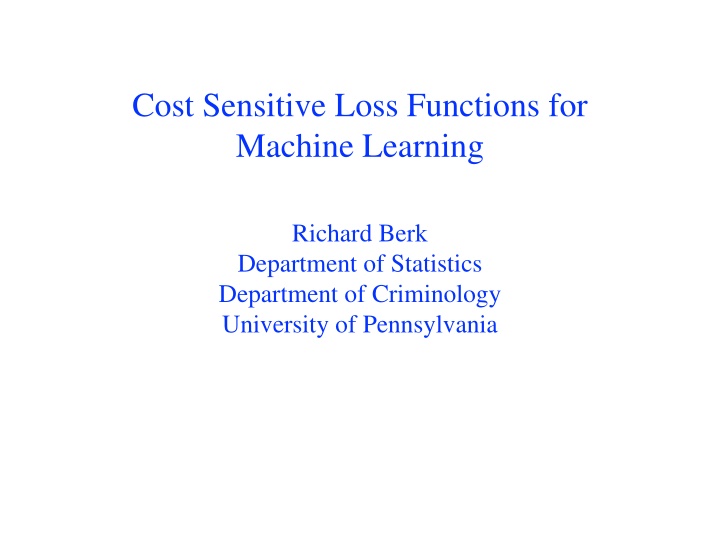
Cost Sensitive Loss Functions for Machine Learning Richard Berk Department of Statistics Department of Criminology University of Pennsylvania
The Take Home Message in 6 Parts 1. Some ML fitting/forecasting errors are worse than others. Underestimates may be more or less costly than overestimates (e.g., number of humpback whales). False positives may be more or less costly than false negatives. (e.g., presence or absence of humpback whales) 2. Standard loss functions used in ML neglect this cost asymmetry because the loss functions used are a straight jacket (e.g., convexity). 3. Forecasts can be misleading as a result, and decision makers can be misled (e.g., a false alarm for a hurricane storm surge). 4. Accuracy and uncertainty measures need to be reconsidered (e.g., MSE) 5. Measures of variable importance and plots of relationships can be misleading (e.g., even just importance rankings). 6. But we can alter some loss functions so that the relative costs of mistakes are more consistent decision-maker needs. Can be a game changer.
Some Mistakes Are Worse Than Others Example: Impute Tuna Bycatch Did the captain alter the data?
Kinds of Mistakes Underestimate Y Numeric Error Overestimate X Positives Classification Error Z False Positive False Negative Negatives X
Classification Loss in CART (e.g., False Positives v. False Negatives Gini Loss Bayes Error Cross-Entropy - Deviance
Some Common Loss Metrics For Numeric Response Variables
Standard Loss Function for Numeric Y Overestimates Underestimates
Robust Loss Function for Numeric Y Overestimates Underestimates
Three Solutions 1. For numeric Y: change the loss function (e.g., use quantile loss) 2. For categorical Y: change the classification rule (e.g., away for .50 threshold) 3. For categorical Y: change the prior (e.g., away from the empirical prior) Stratified sampling (e.g., over-sample cases with more costly errors) Weight the data (e.g., weight more heavily cases with more costly errors)
Default Costs Random Forest Confusion Table No Bycatch Predicted Bycatch Predicted Missclassification Rate No Bycatch reported 345 30700 0.01 False Positives Bycatch Reported 3190 783 0.81 False Negatives Forecasting Error 0.09 0.31
2 to 1 Costs Ratio Random Forest Confusion Table No Bycatch Predicted Bycatch Predicted Missclassification Rate No Bycatch reported 3501 27544 0.11 False Positives Bycatch Reported 1733 2195 0.44 False Negatives Forecasting Error 0.31 0.51
An Asymmetric Linear Loss Function for ? Less Then .50 high Loss low - + 0 Overestimates Underestimates Deviation Score
An Asymmetric Linear Loss Function for ? Greater Than .50 high Loss low - + 0 Overestimates Underestimates Deviation Score
Quantile Gradient Boosting With Cost Ratios of 1 to 9, 1 to 1, and 9 to 1
Quantile Neural Network With Cost Ratios of 1 to 9, 1 to 1, and 9 to 1
Variable Importance Using Reductions in Classification Accuracy These will often change with different cost ratios
Partial Dependence Plots These will often change with different costs for errors
DONE, Thanks
