Confidence Intervals for Mean Adult Body Temperature
Learn how to perform a 95% confidence interval to predict the mean adult body temperature using a sample of randomly chosen temperatures. Verify if assumptions/conditions are satisfied, decide between z or t and calculate the interval. Graphical representation, center, and spread determination are covered. Finally, make conclusions based on the interval and supporting arguments.

Download Presentation

Please find below an Image/Link to download the presentation.
The content on the website is provided AS IS for your information and personal use only. It may not be sold, licensed, or shared on other websites without obtaining consent from the author.If you encounter any issues during the download, it is possible that the publisher has removed the file from their server.
You are allowed to download the files provided on this website for personal or commercial use, subject to the condition that they are used lawfully. All files are the property of their respective owners.
The content on the website is provided AS IS for your information and personal use only. It may not be sold, licensed, or shared on other websites without obtaining consent from the author.
E N D
Presentation Transcript
Confidence Intervals : Means CHAPTER 22 CI
Quantitative Data Sample Statistics Population Parameters ? = mean ? = mean ? = standard deviation ??= standard deviation
Assumptions/Conditions n chosen randomly n independent ? < 10% Nearly normal if ? < 25 n = sample size
Z vs T t-distribution z- distribution Use when is unknown Degrees of freedom = ? 1 Use when is known
Confidence Interval Procedure: Use sample to make a prediction about mean of population 95% Confidence Interval Left area = 0.025 90% Confidence Interval Left area = 0.05
Count = SD = ? ? Use z-distribution Count = SE = ?? ? ? Use t-distribution 2nd VARS #3 ? = = invnorm invnorm(area left) t = t = invt invt(area left, df) or t (area left, df) or t- -table (area left) df = n 1 table 2nd VARS #4 ? ?+ ? CI = CI = ? SD SD + + center center = = ? ?? ?+ ? CI = CI = ? SD SD + + center center = = ?
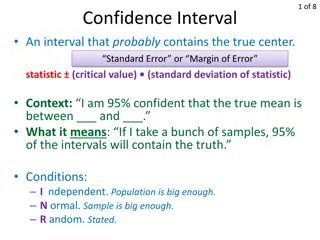
Conclusions We don t say We say We are __% confident that the true mean of __ is between __ and __. We expect __% of all possible confidence intervals calculated with sample size n to contain the true mean of the population. There is a __% chance of a particular value in the interval. There is a __% chance the mean of the population is in the interval.
Ex 1: Mean Adult Body Temperature Perform a 95% Confidence Interval to predict the mean adult body temperature. Check the assumptions/conditions are met. Is this categorical or quantitative data? Sketch a graph. What do you use as the center and spread? Should you use z or t and calculate? What is the area to the left? Calculate the confidence interval Check using STAT TESTS #8 (T interval) Make a conclusion in the context of the problem Use your interval to support the claim that the mean adult body temperature is 98.6 ?
To answer these questions, we need to collect some data. Below are measured body temperatures of 24 random adults. 98.3, 98.9, 97.7, 98.8, 97.9, 98.3, 98.8, 98.2, 97.6, 97.5. 98.9, 98.0, 98.7, 99.1, 98.6, 98.7, 98.5, 98.8, 98.7, 98.4, 98.8, 98.9, 98.6, 98.7 Are the conditions met? n chosen randomly n independent Ex 1 STAT EDIT#1 STATPLOT #1 ZOOM #9 ? < 10% Nearly normal if ? < 25
Is this categorical or quantitative data? Sketch a graph. What do you use as the center and spread? Should you use z or t and calculate? Ex 1 Count = SD = ? Use z-distribution ? Count = SE = ?? Use t-distribution df = n 1 ? ?????? = ? = 98.5 ?? =0.447 24 ??= 0.447 = 0.0912434929 0.09 = ????? STAT CALC #1 Mean Adult Body Temp t-distribution df= n-1 = 23 98.59 98.68 98.77 98.32 98.41 98.5 98.23
What is the area to the left? Calculate the confidence interval Check using STAT TESTS #8 (T interval) Ex 1 STAT TESTS #8 2.5% 2.5% 95% Mean Adult Body Temp t-distribution df= n-1 = 23 98.23 98.32 98.59 98.68 98.77 98.41 98.5 t = invt(area left, df) = invt(0.025, 23) = -2.069 CI = ? SD + center = 2.069*0.09 + 98.5 = (98.31379, 98.68621)
Make a conclusion in the context of the problem Use your interval to support the claim that the mean adult body temperature is 98.6 ? Ex 1 We are 95% confident that the true mean of adult body temperature is between 98.3 and 98.7 degrees. Yes, our interval supports the claim since 98.6 ? is in the interval.
Ex 2: Valencia Class Size Valencia college boasts about having small class sizes and states the average class size is 23 students on their webpage. From a random sample of 41 classes on east campus, the average number of students per class was 22.2 with a standard deviation of 4.2. Perform a 95% Confidence Interval to determine if it is different from reported by Valencia. Conditions/assumptions met? Is this categorical or quantitative data? Sketch a graph. What do you use as the center and spread? Should you use z or t and calculate? What is the area to the left? Calculate the confidence interval Check using STAT TESTS #8 (T interval) Make a conclusion in the context of the problem
Ex 2: Valencia Class Size Valencia college boasts about having small class sizes and states the average class size is 23 students on their webpage. From a random sample of 41 classes on east campus, the average number of students per class was 22.2 with a standard deviation of 4.2. Perform a 95% Confidence Interval to determine if it is different from reported by Valencia. ? = 23 ? = 22.2 = ?????? ??= 4.2 ? = 41 df = 40 SD=SE=?? 4.2 41= 0.6559297999 = ????? ?= ? = ???? 0.025,40 = 2.0211 CI = ? SD + center = (20.874, 23.526) Since 23 is in the interval, there is evidence to support Valencia s claim. Check using STAT TESTS #8