College Success Metrics and Goals for Achieving Student Excellence
Explore the comprehensive vision for student success in higher education institutions, including local goal-setting, Chancellor's goals, and institution-set standards. Learn about key objectives such as completion rates, transfer success, unit accumulation, workforce readiness, and equity initiatives to bridge achievement gaps among student groups. Embrace the strategic goals outlined to elevate student outcomes and enhance educational quality.

Uploaded on | 0 Views
Download Presentation

Please find below an Image/Link to download the presentation.
The content on the website is provided AS IS for your information and personal use only. It may not be sold, licensed, or shared on other websites without obtaining consent from the author. Download presentation by click this link. If you encounter any issues during the download, it is possible that the publisher has removed the file from their server.
E N D
Presentation Transcript
Student Success Metrics PBC: January 16, 2019
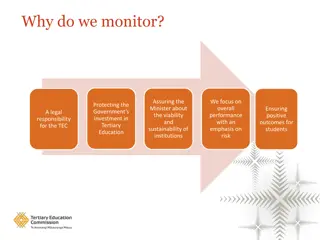
Local Goal-Setting 5 key goals as of July 2017 New Vision for Success from State Chancellor: Local Boards must: Adopt local goals aligned with the Vision for Success Ensure local goals are measurable Align our comprehensive plan to our new local goals Align our budget with our comprehensive plan Specify timeline for improvement Submit adopted goals to the CCCCO by May 31, 2019
Vision for Success Goals Chancellor s Goal GOAL 1: Completion Associate degrees, credentials, certificates, or specific job skill sets for in-demand jobs Increase by 20% by 2021-22 GOAL 2: Transfer Transfers to a UC or CSU Increase by 30% of 2021-22 GOAL 3: Unit Accumulation # of units accumulated by CCC students earning associate degrees Decrease from 87 (average units) to 72 GOAL 4: Workforce % of exiting CTE students who report being employed in their field of study Increase % of CTE graduates employed in their field from 69% (statewide average) to 76% GOAL 5: Equity Reduce equity gaps across all of the above measures through faster improvements among traditionally underrepresented student groups Cut achievement gaps by 40% by 2021-22 and fully close them for good by 2026-27
Vision for Success Goals Institution-set Standards (ACCJC) GOAL 1: Completion Associate degrees, credentials, certificates, or specific job skill sets for in-demand jobs Degrees and certificates awarded GOAL 2: Transfer Transfers to a UC or CSU Transfers to 4-year colleges and universities GOAL 3: Unit Accumulation # of units accumulated by CCC students earning associate degrees None CTE certificates and degree programs which have licensure requirements # of such programs Licensure exam pass rates for those programs Job placement rates GOAL 4: Workforce % of exiting CTE students who report being employed in their field of study GOAL 5: Equity Reduce equity gaps across all of the above measures through faster improvements among traditionally underrepresented student groups Not in institution-set standards now (in Equity Plan)
Caada College Institutional-Set Standards and Goals 2017-2018 Trend Line 2013/ 2014 69.3% 2017/ 2018 72.4% Standard for ACCJC 70.0% Aspirational 2014/ 2015 70.2% 2015/ 2016 70.8% 2016/ 2017 72.0% Data extracted 10/2018 SMCCD Data Dashboard Ca ada Program Review Data Packets Goal 72.0% 1. Successful course completion rate (%) 64.0% 62.5% 65.5% 64.5% 61.8% 62.0% 66.0% 2. Fall-to-fall persistence rate (%) (First-Time Student) 300 422 463 486 585 558 380 3. Degree completion (total #) 240 260 293 276 307 TBD 300 4. Transfer (total #) 150 193 217 217 243 TBD 170 4.a. UC/CSU Transfer # 280 400 332 244 292 372 300 5. Certificate completion (total #) 100% 100% 6. Licensure Pass Rate: Radiological Technology National Exam 100% 100% 100% 100% 100% 100% 87.5% 93.3% 91.7% 100% 100% 100% 7. Job Placement (Radiology Technology only) 80.0% 77.1% 78.7% 75.2% 80.1% 75.7% 82.0% 8. Fall-to-spring persistence rate (%) (First-Time Student) 62.0% 59.8% 63.6% 63.9% 68.5% 63.4% 64.0% 9. Student success rates during their first year (First-Time Student) 66.0% 66.7% 67.0% 67.9% 67.2% 69.6% 68.0% 10. Success in GE 53.0% 57.5% 59.3% 61.9% 64.5% 67.5% 56.0% 11. Success in DE 78.0% 79.0% 78.0% 77.7% 79.5% 78.0% 80.0% 12. Success in CTE 57.0% 55.3% 58.2% 61.2% 64.1% 62.3% 59.0% 13. Success in Pre-transfer 70.0% 69.0% 72.8% 75.0% 76.1% 72.7% 72.0% 14. Success in Non-CBET ESL 57.0% 15. % of students placed in pre-transfer math that take pre-transfer math (First-Time Student) 58.2% 53.0% 57.3% 53.1% 49.8% 55.0% 57.0% 16. % of students placed in pre-transfer English that take pre-transfer English (First-Time Student) 50.2% 54.9% 61.5% 51.8% 50.7% 55.0% 3900 4203 4096 4051 3956 3664 4100 18. FTES (Total #) 500 479 482 470 486 478 525 19. Productivity (Year)
Vision for Success Goals Chancellors Goal Caada Metrics* GOAL 1: Completion Associate degrees, credentials, certificates, or specific job skill sets for in-demand jobs Degrees: Certificates: 372 Total 558 Increase by 20% by 2021-22 184 more? 920 GOAL 2: Transfer Transfers to a UC or CSU UC: CSU: Total 121 184 305 Increase by 30% of 2021-22 92 more? GOAL 3: Unit Accumulation # of units accumulated by CCC students earning associate degrees Decrease from 87 to 72 (average units) Units (avg): 93 21 less? GOAL 4: Workforce % of exiting CTE students who report being employed in their field of study Increase % of CTE graduates employed in their field from 69% (statewide average) to 76% CTEOS survey sample 65% GOAL 5: Equity Reduce equity gaps across all of the above measures through faster improvements among traditionally underrepresented student groups Current Equity Plan Goal (example): Increase fall to spring persistence rate for DI students (focus on African American/Black (5%) and Latinx/Hispanic (3%) students) over two years Cut achievement gaps by 40% by 2021-22 and fully close them for good by 2026-27 *Data is for 2017-18 academic year (except UC transfers). CSU transfers: Skyline=518; CSM=426 in 2017-18; UC data for 2017: Skyline=164; CSM=247. Units earned are for 2017-18 (v. 3-year avg (100)shown on Oct. Flex)
Student Equity & Achievement Plan (new) Successful enrollment Persistence (Fall to Spring) Transfer to 4-year Completion of transfer level math and English Degree and certificate (18+ units) completion (add: HS equivalency and noncredit certificates)
Student Equity & Achievement Plan (new) (A) Current or former foster youth. (B) Students with disabilities. (C) Low-income students. (D) Veterans. (E) Ethnic and racial categories (i) American Indian or Alaska Native. (ii) Asian. (iii) Black or African American. (iv) Hispanic or Latino. (v) Native Hawaiian or other Pacific Islander. (vi) White. (vii) Some other race. (viii) More than one race. (F) Homeless students. (G) Lesbian, gay, bisexual, or transgender students. (H) Gender (I) Additional categories of students determined by the governing board of the community college district. Successful enrollment Persistence (Fall to Spring) Transfer to 4-year Completion of transfer level math and English Degree and certificate (18+ units) completion (add: HS equivalency and noncredit certificates)
Student Success Metrics Successful Enrollment Students who enrolled in a course within a year of applying Students with an adult education or ESL skills gain Learning Progress Course success rate Students who completed transfer-level English and math within one year of enrolling in a district Students who completed an adult education level Students with a noncredit workforce milestone Students who completed 9+ CTE units Students who successfully completed unit thresholds in the fall Students who successfully completed unit thresholds in the academic year Momentum Students retained from fall to spring Students who transitioned from noncredit to credit Unduplicated count of students who earned each of the following award types: a noncredit certificate over 48 contact hours a Chancellor s Office approved credit certificate (over 16 units, per SSFF) associate degree associate degree for transfer CCC bachelor s degree apprenticeship journey status Students who transferred to a four-year institution (Vision for Success: transfer to UC or CSU) Average number of units accumulated by associate degree earners Success Students who were unemployed who became employed Employment Career education students who reported that their job is closely or very closely related to their field of study who did not transfer Median annual earnings for non-transfer exiting students, in the first year after exit Median change in earnings for non-transfer exiting students Earnings Students who exited but did not transfer who attained the living wage for a single adult in the county where the college s district office is located
PBC Timeline - Spring 2019 ACCJC Institutional Self-Evaluation February: DRAFT of complete ISER circulates campus-wide March 20: PBC approves final ISER April 24: Board of Trustees presentation Student Equity Plan April 17: PBC approves Student Equity Plan May 15: Board of Trustees Presentation June 30: Submission of approved plan to CCCCO Student Success Goals February April: Review data and set local goals May: Local goals go to SMCCD Board and to CCCCO by May 31 Annual Strategic Plan March-April: develop draft (in conjunction with other SEA, Enrollment Management, and other plans) May 15 adoption for 2019-20


")
")