Clinical Characteristics of Liver Disease in Patients with Common Variable Immunodeficiency (CVID)
This study examines the clinical features of liver disease in patients with CVID, revealing insights into the relative frequency, age at onset, duration of follow-up, immunosuppressive treatments, examinations performed, and histological features observed. The data sheds light on the association between CVID and liver complications, providing valuable information for healthcare management and further research.
Download Presentation

Please find below an Image/Link to download the presentation.
The content on the website is provided AS IS for your information and personal use only. It may not be sold, licensed, or shared on other websites without obtaining consent from the author.If you encounter any issues during the download, it is possible that the publisher has removed the file from their server.
You are allowed to download the files provided on this website for personal or commercial use, subject to the condition that they are used lawfully. All files are the property of their respective owners.
The content on the website is provided AS IS for your information and personal use only. It may not be sold, licensed, or shared on other websites without obtaining consent from the author.
E N D
Presentation Transcript
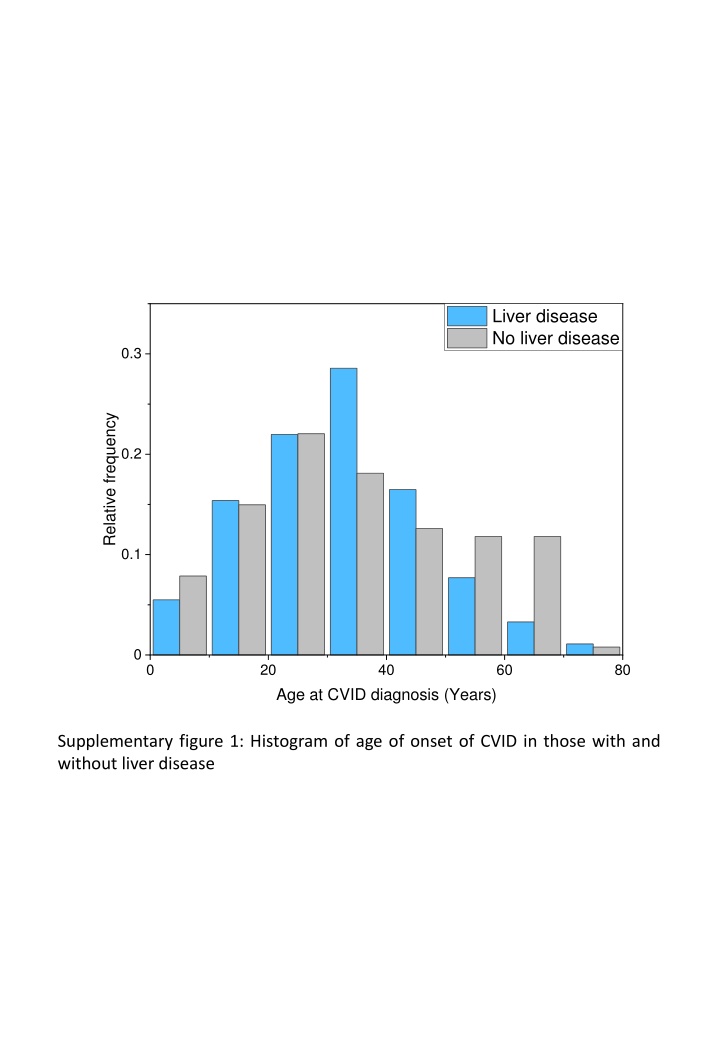
Liver disease No liver disease 0.3 Relative frequency 0.2 0.1 0 0 20 40 60 80 Age at CVID diagnosis (Years) Supplementary figure 1: Histogram of age of onset of CVID in those with and without liver disease
0.4 Liver disease No liver disease 0.3 Relative Frequency 0.2 0.1 0 0 20 40 60 Duration of follow up (Years) Supplementary figure 2: Duration of follow up of those with and without liver disease
Liver Disease n 91 91 90 62 25 35 43 40 36 44 No liver disease n 127 116 115 22 8 36 40 3 0 0 Total % % n % Total CT scan of thorax Abdominal imaging Upper GI endosocopy Video Capsule Endoscopy Lower GI endoscopy Small bowel histology Fibroscan HVPG measurement Liver biopsy CT: computed tomography, USS: ultrasound scan, MRI: magnetic resonance imaging, GI: gastrointestinal, HVPG: hepatic venous pressure gradient Supplementary table 1: Examinations performed in patient cohort 41.7 100.0 98.9 68.1 27.5 38.5 47.3 44.0 40.0 48.3 58.3 91.3 90.6 17.3 6.3 28.3 31.5 2.4 0.0 0.0 218 207 205 84 33 71 83 43 36 44 100 95.0 94.0 38.5 15.1 32.6 38.1 19.7 16.5 20.2 USS, CT, MRI
Immunosuppress Liver Disease No liver disease Total p n % n % n % ion exposure Any 49 53.8 57 44.9 106 48.6 0.19 Corticosteroids 45 49.5 55 43.3 100 45.9 0.36 Mycophenolate 12 13.2 5 3.9 18 7.8 0.012 mofetil Rituximab 15 16.5 5 3.9 20 9.6 0.002 Azathioprine 3 3.3 2 1.6 5 2.3 0.40 Ciclosporin 2 2.2 2 1.6 4 1.8 0.74 Anti-TNF 6 6.6 2 1.6 8 3.7 0.05 Sirolimus 2 2.2 0 0.0 2 0.9 0.09 Other Supplementary Table 2: Immunosuppressive treatments received by CVID patients with and without liver disease 2 2.2 3 2.4 5 2.3 0.94
Histological features n % Nodular Regenerative Hyperplasia 30 63.8 Granulomata 11 23.4 Fibrosis stage 0 2 4.7* 1 6 13.9* * n=43 where fibrosis 2 13 30.2* stage could be 3 20 46.5* assessed 4 2 4.7* Unable 4 8.5 Steatosis 6 12.8 Biliary features 11 23.4 Inflammatory infiltrate 38 80.9 Supplementary table 3: histological features observed in 47 patients with CVID who underwent liver biopsy
Fibroscan performed No fibroscan n %, (IQR) n %, (IQR) p Total 40 100 51 100.0 Gender 0.68 Male 19 47.5 22 43.1 Female 21 52.5 29 56.9 Age (years) 0.24 At CVID diagnosis 35 (22-41.5) 30 (20-40) Decades of diagnosis 0.11 60- 79 1 2.5 8 15.7 80- 99 14 35 17 33.3 00- 25 62.5 26 51.0 Follow up (years) 0.24 17 (10-28) 19 (13-27) Lung disease 0.54 Any 30 75 41 80.4 0.12 ILD / GLILD 18 45 15 29.4 0.09 Bronchiectasis 23 57.5 38 74.5 Splenomegaly >12cm 0.09 33 82.5 34 66.7 0.39 Splenectomy 2 5 5 9.8 GI disease 0.54 Any 25 62.5 35 68.6 0.71 Chronic diarrhoea 22 55 30 58.8 0.51 enteropathy 20 50 29 56.9 0.70 IBD-like 3 7.5 5 9.8 0.66 Villous blunting 5 22.7 (n=22) 6 28.6 (n=21) 0.70 Infective 10 25 11 21.6 0.70 Norovirus 3 7.5 5 9.8 0.16 Giardia 7 17.5 4 7.8 0.76 Other 3 7.5 3 5.9 Joint disease 0.34 Any 13 32.5 12 23.5 0.86 Arthritis 5 12.5 7 13.7 Cytopaenia 0.98 Any 15 37.5 19 37.3 0.82 ITP 14 35 19 37.3 0.59 AIHA 4 10 7 13.7 0.46 AI neutropaenia 4 10 3 5.9 Other autoimmunity 0.92 Any 6 15 8 15.7 0.95 Thyroid disease 3 7.5 4 7.8 0.70 Other 3 24 7.5 60 5 15 9.8 29.4 Portal HTN (endoscopic, radiological or HVPG>5) Other investigations and assessment of PHTN HVPG measurement 0.004 Liver Biopsy 27 68 21 41 0.01 Endoscopy 34 85 28 55 0.002 Radiology 40 100 50 98 0.37 24 60 13 25 <0.001 Supplementary table 4: Clinical characteristics of patients with liver disease who underwent Fibroscan compared to those who did not
Endoscopy performed No endoscopy n 62 %, (IQR) 100.0 n 29 %, (IQR) 100.0 p Total Gender 28 45.2 13 44.8 0.98 Male 34 54.8 16 55.2 Female Age (years) 32 (20-41) 32 (22-40) 0.89 At CVID diagnosis Decades of diagnosis 5 8.1 4 13.8 0.34 60- 79 24 38.7 7 24.1 80- 99 33 53.2 18 62.1 00- Follow up (years) 18 (14-27) 16 (9-24) 0.43 Lung disease 50 80.6 21 72.4 0.38 Any 26 41.9 7 24.1 0.10 ILD / GLILD 43 69.4 18 62.1 0.49 Bronchiectasis Splenomegaly >12cm 52 83.9 15 51.7 0.001 3 4.8 4 13.8 0.14 Splenectomy GI disease 47 75.8 13 44.8 0.004 Any 43 69.4 9 31.0 <0.001 Chronic diarrhoea 39 62.9 10 34.5 0.01 enteropathy 6 9.7 2 6.9 0.66 IBD-like 17 27.4 4 13.8 0.15 Infective 8 12.9 0 0.0 0.04 Norovirus 8 12.9 3 10.3 0.73 Giardia 5 8.1 1 3.4 0.41 Other Joint disease 17 27.4 6 20.7 0.49 Any 9 14.5 3 10.3 0.58 Arthritis Cytopaenia 24 38.7 10 34.5 0.70 Any 23 37.1 10 34.5 0.81 ITP 8 12.9 3 10.3 0.73 AIHA 7 11.3 0 0.0 0.06 AI neutropaenia Other autoimmunity 11 17.7 3 10.3 0.36 Any 6 9.7 1 3.4 0.30 Thyroid disease 6 9.7 2 6.9 0.66 Other Supplementary table 5: Clinical characteristics of patients with liver disease who underwent upper gastrointestinal endoscopy compared to those who did not
HVPG measured No HVPG measurement n %, (IQR) n %, (IQR) p Total 36 100.0 55 100.0 Gender 0.22 Male 23.0 63.9 28 50.9 Female 13 36.1 27 49.1 Age (years) At CVID diagnosis 30.0 (20.5-38) 32.0 (21-43) 0.53 0.53 Decades of diagnosis 60- 79 2.0 5.6 7 12.7 80- 99 13 36.1 18 32.7 00- 21 58.3 30 54.5 Follow up (years) 16.6 (14-25.5) 17.0 (10-27) 0.48 Lung disease Any 26.0 72.2 45 81.8 0.28 ILD / GLILD 14.0 38.9 19 34.5 0.67 Bronchiectasis 21.0 58.3 52 94.5 <0.001 Splenomegaly >12cm 32.0 88.9 35 63.6 <0.001 Splenectomy 3.0 8.3 4 7.3 0.85 GI disease Any 24.0 66.7 46 83.6 0.06 Chronic diarrhoea 19.0 52.8 33 60.0 0.50 enteropathy 20.0 55.6 29 52.7 0.79 IBD-like 3.0 8.3 5 9.1 0.90 Villous blunting 8.0 47.1 (n=17) 3 11.5(n26) 0.009 Infective 9.0 25.0 12 21.8 0.72 Norovirus 4.0 11.1 4 7.3 0.53 Giardia 6.0 16.7 5 9.1 0.28 Other 1.0 2.8 5 9.1 0.24 Joint disease Any 10.0 27.8 13 23.6 0.66 Arthritis 4.0 11.1 8 14.5 0.64 Cytopaenia Any 17.0 47.2 17 30.9 0.12 ITP 17.0 47.2 16 29.1 0.08 AIHA 6.0 16.7 5 9.1 0.28 AI neutropaenia 4.0 11.1 3 5.5 0.32 Other autoimmunity Any 6.0 16.7 8 14.5 0.78 Thyroid disease 3.0 8.3 4 7.3 0.85 Other 4.0 11.1 4 7.3 0.52 Supplementary table 6: Clinical characteristics of patients with liver disease who underwent hepatic venous pressure gradient measurement compared to those who did not
Liver Biopsy No Liver biopsy n %, (IQR) n %, (IQR) p Total 47 100 44 100 Gender 0.94 Male 21 44.7 20 45.5 Female 26 55.3 24 54.5 Age (years) At CVID diagnosis 32 (20-41) 32 (21-41) 0.71 0.42 Decades of diagnosis 60- 79 3 6.38 6 13.6 80- 99 18 38.3 13 29.5 00- 26 55.3 25 56.8 Follow up (years) 17 (13-26) 18 (10-28) 0.47 Lung disease Any 37 78.7 34 77.3 0.87 ILD / GLILD 22 46.8 11 25 0.03 Bronchiectasis 30 63.8 31 70.5 0.50 Splenomegaly >12cm 40 85.1 27 61.4 <0.001 Splenectomy 5 10.6 2 4.55 0.28 GI disease Any 32 68.1 28 63.6 0.65 Chronic diarrhoea 27 57.4 25 56.8 0.95 enteropathy 27 57.4 22 50 0.48 IBD-like 5 10.6 3 6.82 0.74 Villous blunting 10 40 (n 25) 1 5.6 (n 18) 0.01 Infective 12 25.5 9 20.5 0.57 Norovirus 6 12.8 2 4.55 0.17 Giardia 6 12.8 5 11.4 0.84 Other 2 4.26 4 9.09 0.35 Joint disease Any 14 29.8 9 20.5 0.31 Arthritis 6 12.8 6 13.6 0.90 Cytopaenia Any 21 44.7 13 29.5 0.14 ITP 21 44.7 12 27.3 0.08 AIHA 7 14.9 4 9.09 0.39 AI neutropaenia 5 10.6 2 4.55 0.28 Other autoimmunity Any 8 17 6 13.6 0.65 Thyroid disease 4 8.51 3 6.82 0.76 Other 5 10.6 3 6.82 0.52 Supplementary table 7: Clinical characteristics of patients with liver disease who underwent liver biopsy compared to those who did not
A 20 HVPG (mmHg) HVPG (mmHg) 10 0 No Yes Radiological or endoscopic evidence of portal hypertension B AUROC Measure of portal hypertension Area 95% CI p Endoscopic / radiological evidence 0.57 0.38-0.77 0.45 Supplementary figure 3: A Hepatic venous pressure gradient (HVPG) measurements and evidence of portal hypertension by endoscopic or radiological assessment in patients with CVID-related liver disease (line represents median value). B receiver operator curve and area under receiver operator curve (AUROC) characteristics for HVPG as a predictor of endoscopic or radiological evidence of portal hypertension.
Univariate 95% CI Lower Multivariate 95% CI Lower HR Upper p HR Upper p 0.74 1.05 0.44 1.00 2.82 3.125 2.62 1.94 1.52 2.13 1.41 0.88 0.88 1.24 1.65 0.69 1.24 1.81 1.45 1.54 1.57 0.60 1.56 1.87 2.08 1.94 1.40 1.64 1.52 2.49 0.35 1.02 0.17 1.55 1.07 1.14 0.42 <0.001 0.09 Male Gender Age at CVID diagnosis Era of diagnosis (years) 80- 99 00- 1.06 1.03 1.09 <0.001 1.33 1.09 1.27 0.83 0.73 0.64 0.65 0.44 0.42 0.61 0.49 0.28 0.57 0.73 0.70 0.72 0.47 0.08 0.47 0.90 1.00 0.58 0.49 0.22 0.20 0.86 6.01 8.96 5.42 4.54 3.18 7.06 3.07 1.79 1.78 2.55 5.54 1.70 2.71 4.46 3.04 3.27 5.25 4.43 5.21 3.90 4.34 6.48 4.01 12.09 11.44 7.22 0.007 0.03 0.009 0.125 0.26 0.22 0.39 0.72 0.72 0.56 0.42 0.42 0.59 0.20 0.32 0.26 0.46 0.61 0.47 0.10 0.05 0.28 0.54 0.63 0.69 0.09 Liver disease Lung disease 3.22 1.38 7.50 0.007 Any Interstitial Bronchiectasis >12.5cm Splenectomy 1.52 0.65 3.59 0.33 Splenomegaly Persistent lymphadenopathy Gastrointestinal disease Any Chronic diarrhoea Non-infective enteropathy Inflammatory bowel disease Infective diarrhoea Arthralgia Inflammatory arthritis Any ITP AIHA AI neutropaenia Rheumatological involvement Cytopaenia Thyroid disease Exposure to immunosuppression Any Corticosteroids Mycophenolate mofetil Rituximab Azathioprine Ciclosporin Anti-TNF 2.28 0.96 5.41 0.06 0.84 0.25 2.77 0.77 Supplementary table 8: Cox-proportional hazard models for the risk of death in the population of CVID patients excluding those diagnosed in the 1960s and 1970s
