Challenges in Hurricane Wind Speed Calibration and Validation Metrics
Need for accurate extreme wind measurements is crucial for various applications like hurricane tracking, climate monitoring, and oceanography. This includes reliance on dropsondes for wind speed calibration, validation metrics using multiple methods, and challenges in integrating different sources of wind data. Moored buoys are essential for in-situ calibration, while issues with dropsondes include difficulties near the surface and inconsistencies in wind profiles.

Download Presentation

Please find below an Image/Link to download the presentation.
The content on the website is provided AS IS for your information and personal use only. It may not be sold, licensed, or shared on other websites without obtaining consent from the author.If you encounter any issues during the download, it is possible that the publisher has removed the file from their server.
You are allowed to download the files provided on this website for personal or commercial use, subject to the condition that they are used lawfully. All files are the property of their respective owners.
The content on the website is provided AS IS for your information and personal use only. It may not be sold, licensed, or shared on other websites without obtaining consent from the author.
E N D
Presentation Transcript
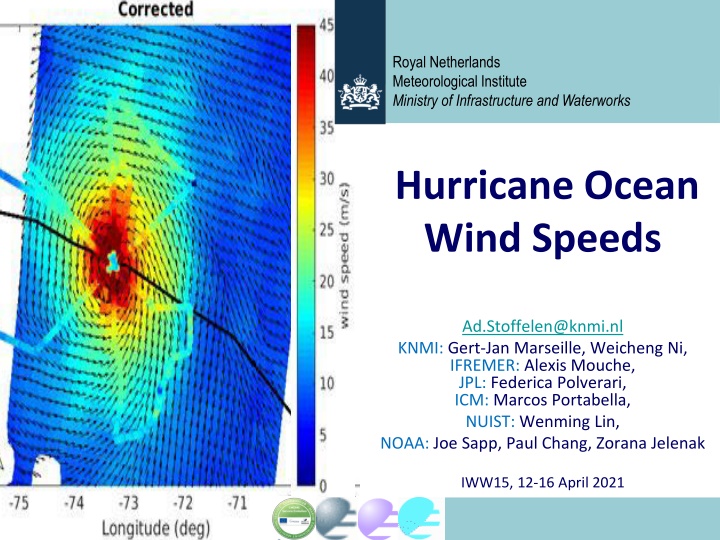
Royal Netherlands Meteorological Institute Ministry of Infrastructure and Waterworks Hurricane Ocean Wind Speeds Ad.Stoffelen@knmi.nl KNMI: Gert-Jan Marseille, Weicheng Ni, IFREMER: Alexis Mouche, JPL: Federica Polverari, ICM: Marcos Portabella, NUIST: Wenming Lin, NOAA: Joe Sapp, Paul Chang, Zorana Jelenak IWW15, 12-16 April 2021
Need for accurate extreme winds Nowcasting, though dropsondes are the adopted wind speed reference here; if the wind speed reference changes, hurricane scales change too as everything relies on dropsonde wind speed calibration (SFMR, Dvorak, .. ) NWP, to formulate drag and air-sea interaction stresses Oceanography, to determine mixing depth in hurricanes Climate monitoring, to determine climate change at the extremes Climate prediction, to well describe coupled ocean and atmosphere dynamics Improved description of hurricane dynamics Satellite ocean surface wind speed calibration for active and passive microwave remote sensing
Validation metrics 250 Based on dropsondes as these are used in the operational community (though open questions remain on their accuracy as articulated in CHEFS) Use CHEFS method for spatial scaling, collocation, .. SFMR, Dvorak, SMAP, SMOS, .. , depend on dropsondes Use stress-equivalent 10-m ECMWF and buoy winds Triple collocation CMOD7D 240 230 220 210 200 Dropsonde 1:1 190 180 170 160 150 140 SFMR speed 130 120 110 100 90 80 70 60 50 40 30 20 10 0 0 10 20 30 40 50 60 70 80 90 CMOD7 ASCAT speed Polverari et al., in review
Moored buoys Best controlled resource for in-situ wind speed calibration at moderate and high winds Work well up to 25 m/s as verified with wind tower Dynamically corrected platform winds Claims of ocean wave shielding lead to non-substantiated sources Cup anemometer biases at extreme winds may be a few % (only) Rare encounter with hurricanes Ethan Wright, IOVWST 2021 Hurricane Lana at buoy 51002 1-min m/s Gust m/s PMSL-955 mb 50.0 45.0 40.0 Wind m/s , PMSL-955 mb 35.0 30.0 25.0 20.0 15.0 10.0 5.0 0.0 12 13 14 15 Hour on 23 August 2018 16 17 18 19 20 21
Dropsondes open issues Dropsondes cannot follow the wind near the surface, due to the strong deceleration as function of the drag; The correction for this leads to an integration effect in the vertical, where the wind profile is logarithmic; 10-m SFMR winds in hurricanes are inconsistent with a log profile; The position computation by the dropsonde GPS chip has not (yet) been investigated, nor its derivation of speed and acceleration, with may cause further bias in strong deceleration (drag); Most passive satellite winds, SFMR, best track, etc. are all calibrated with respect to dropsondes and show the same inconsistency with respect to the buoy winds; The above conversion takes the spatio-temporal scale of the verification sources into account, hence differences are believed not to be dominated by local gradient effects; On the other hand, ASCAT and ECMWF follow the moored buoy scale (up to recently). Buoy winds are not frequent in hurricanes, but are validated by masts to be unbiased up to 25 m/s (within ~10%), while at 25 m/s the conversion bias from (1) is 45%; Other in-situ (incl. land-based) wind sources suffer from wind flow distortion biases, positive and negative, or from height down conversion errors to 10m; These results call for further investigation of the true in-situ wind speed reference in hurricane conditions. Due to the above-mentioned inconsistency, calibration of satellite winds (above 25 m/s) is uncertain, as well as their assimilation in NWP and the associated drag formulation in Earth System Models. ?0 = 5.0 mm ? = 1.58 m s-1 ?0 = 1.0 mm ? = 1.30 m s-1 ?10?? = 30 m s-1
2DVAR for vortex construction for SAR and scatterometer Exploit SAR for hi-res information
Decadal differences ASCAT-ERA5 Windstorm Information Service C3S WISC ASCAT versus ERA5 first guess Also ERS, QuikScat and OSCAT Passive wind instruments reliable? From 1988
Discussion Hurricanes are among the deadliest and costly natural disasters Extreme wind measurements come in two different flavours Uncertainty about the extremes propagates into the modelling of hurricane dynamics and hurricane occurrence Further research is needed on dropsondes wind speeds, particularly in the lowest tens of meters Although moored buoy winds show less dispersion around 20 m/s than dropsondes, there is room for further uncertainty assessment and attribution (Wright et al., IOVWST 2021) Mixing instruments/producers for determining climate trends is not recommendable due to variable sampling and calibration Validate reanalyses by collocated stable single-instrument series ESA MAXSS project on satellite hurricane winds Further supporting slides follow this slide
EUMETSAT CHEFS Objectives VH GMF: The understanding of the future C- band VH information contribution to high and extreme wind retrievals from C-band scatterometer missions; Spatial scaling of extremes: The definition of spatial scaling issues and related consequences for product sample resolutions and validation approaches; Understanding of extremes: To further understanding of satellite remote sensing of high and extreme wind conditions over the ocean. In-situ wind speed reference needed for all extreme wind products, from satellites, reanalyses to NWP models
CHEFS EUMETSAT ITT 16/166 Extreme winds calibration VH test data KNMI EPS-SG design and VH GMF and retrieval Calibration strategy ICM Scatterometer science IFREMER SAR wind retrieval Data lab, L-band, GMF
Other references? +ve and ve wind flow distortion around platforms Verification shows differences to platforms 2x as high as to buoys; what is this scatter? Does it cause bias? Useful as calibration reference? Hasager et al., 2013 Platform motion (ships) Errors are not well controlled, larger than for moored buoys and tend to be environmentally dependent
Stress-equivalent winds in TCs Only near tropical cyclones (TC) Pressure and humidity affect air mass density Particularly near TC centres At extreme winds up to a few m/s (5%) Needs to be accounted for
ASCAT-VV calibrated to SFMR > 12 m/s apply for x=V(ASCAT): V (ASCAT)=0.0095x2+1.52x-7.6 Better cc, bias, SD and rmse for the same sample with CMOD7D Good match up to 40 m/s Storm centered SFMR relatively high SFMR is based on dropsondes ASCAT VV is based on buoys Recalibrated y = 0.57x + 5.16
Operational CMOD7 versus CMOD7D CMOD7 CMOD7D
VH and L-band TB Linear dependency Theoretically not obvious to relate Bragg to L TB Measurement accuracy will determine quality of L-band and VH extreme winds High rain enhances VH NRCS at 19-22 and 40-43 degrees High rain reduces VH NRCS at 22-25 and 31-34 degrees SCA VH is excellent choice for extremes
Recommendations Use dropsonde U10S rather than WL150 Perform a log-profile analysis Investigate speed-dependent deceleration error dropsondes at 10 m Convert buoys, dropsondes and model winds to U10S Investigate different buoy types and possible wave effects on buoy measurements Investigate direct buoy-dropsonde collocations > 15 m/s After in-situ wind speed calibration, SFMR needs adaptation, as well as all satellite sea surface winds It furthermore will allow NWP model drag parameterization tuning Closer collaboration with JCOMM, satellite wind producers and ECMWF will be very beneficial to consolidate the in situ, satellite winds and NWP community practices Refine ASCAT calibration, VV GMF (cone) and retrieval at high/extreme winds Extend SAR and NOAA campaigns for refined geophysical studies
CHEFS Conclusions We still lack a consolidated in-situ wind speed reference Affects satellite & NWP products and hurricane advisories! Confidence in moored buoys up to 25 m/s U10S needed Questions drop sondes? ASCAT VV correlates well at high winds SCA VH excellent choice ?
Decadal extreme changes Huge year-to-year variability in extremes Depends on El Nino Use longest possible satellite record Depends on observing system sampling, single processor version (calibration, QC), uniform sampling over decade Use overlapping single- instrument/single- processor series for climate analyses
NRT OSI SAF visualization at KNMI Considered as part of ESA MAXSS project Storm-centric tiles based on track predictions of TC and Polar Low? Dropsonde scale SMOS, SMAP, radiometers? High resolution, 5.6 km for ASCATs ? Maintenance in OSI SAF ?
ESA Marine Atmosphere eXtreme Satellite Synergy (MAXSS) IFREMER has scientific lead Tropical Cyclones (TC), extra-tropical cyclones (ETC), polar lows (PL) Integrate research and operational instruments: SMOS, SMAP, SSMI, AMSR, WindSat Integrated product (atlas) Intercalibration, production, visualization, monitoring Application in climate, nowcasting, NWP, .. Links to EUMETSAT OSI SAF, EU C3S, EU CMEMS