Assessment of Small-Scale Wind Turbines for Energy Efficiency
Explore the viability of small-scale wind turbines in terms of energy production efficiency. Delve into the history of wind turbine designs, types like HAWT and VAWT, power generation factors such as Betz limit and power curves, wind resources, turbulence effects, and comparisons of different turbines based on power ratings and outputs. Consider factors such as rated power, rotor diameter, lifetime, and more to evaluate the energy output potential of these turbines.
Download Presentation

Please find below an Image/Link to download the presentation.
The content on the website is provided AS IS for your information and personal use only. It may not be sold, licensed, or shared on other websites without obtaining consent from the author.If you encounter any issues during the download, it is possible that the publisher has removed the file from their server.
You are allowed to download the files provided on this website for personal or commercial use, subject to the condition that they are used lawfully. All files are the property of their respective owners.
The content on the website is provided AS IS for your information and personal use only. It may not be sold, licensed, or shared on other websites without obtaining consent from the author.
E N D
Presentation Transcript
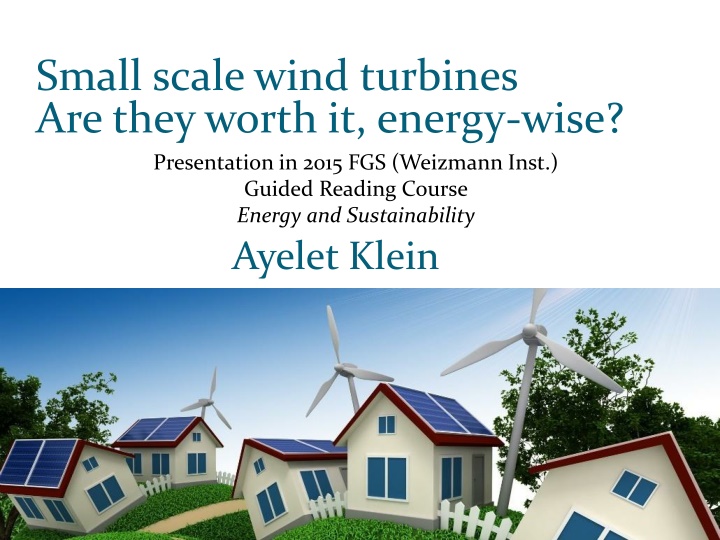
Small scale wind turbines Are they worth it, energy-wise? Presentation in 2015 FGS (Weizmann Inst.) Guided Reading Course Energy and Sustainability Ayelet Klein
History Persian drag machine design, used for water pumping and grain grinding Water pumping machines on the Island of Crete An early mill on the Mediterranean coast
Types Horizontal axis wind turbine (HAWT) Vertical axis wind turbine (VAWT) HAWT HAWT VAWT VAWT
HAWT VAWT Main rotor shaft arranged vertically The generator and gearbox can be placed near the ground Does not need to be pointed into the wind Relatively low rotational speed Main rotor shaft and electrical generator at the top of the tower Must be pointed into the wind
Gross power ??=1 2???3? ? =? ? rotor diameter ? air density ? wind velocity 4?2 [Sahin et al. 2006]
Betz limit - Max power of 59% [Betz 1946]
Power curve [Entec]
Wind resource [Entec]
Turbulence [Roth, 2000]
Small scale Rated power of less than 50kW
Turbine comparison Swift rooftop wind turbine micro HAWT Power rating (kW) 0.6 1.5 Mean annual output (kWh) Rotor diameter (m) 870 / 164 * 2000-3000 1.7 2 Lifetime (y) Rated velocity (m/s) 15 20 12 12 [Allen et al., 2008 & Rankine et al. ,2006 ]
Annual energy output [Allen et al., 2008]
Annual household electricity consumption [DBERR, DCLG ]
Annual energy output 870 kwh 1 5 15 164 kwh 125 [Allen et al., 2008(6)]
Input energy Component manufacture Transportation Installation and maintenance
Turbine components
Small scale turbine components Percentage of total mass 40% 25% 15% 2% Component Tower Nacelle Item Material Aluminium Frame & cover Aluminium Generator Steel Copper carbon fibre- reinforced epoxy (CFRP) Rotors Blades Hub and bolts Aluminium 4% 1% 1% Steel [Allen et al., 2008 & Rankine et al. ,2006 ]
Small scale turbine components Aluminium 70% Steel 16 % Copper 2% Epoxy resin 4% Others 4% [Rankine et al. ,2006]
Component manufacture Energy consumption (MJ/kg) 4 60 42 206 Material concrete Stainless Steel Steel Aluminium Recycled aluminium (100%) Copper Epoxy Glass fiber Carbon fiber 19 67 46 115 200 [Allen et al., Rankine et al., Crawford, Schleisner , Lenzen et al., Fleck et al.]
Component manufacture Energy consumption per kg without recycled aluminium (MJ) 7 145 Energy consumption per kg with recycled aluminium (MJ) 7 72 Material Steel Aluminium Recycled aluminium (100%) Copper Epoxy Carbon fibre Total Total for 95 kg - 7 1 2 8 97 9190 1 2 8 163 15430 [Allen et al., 2008 & Rankine et al. ,2006 ]
Transportation Fuel consumption (l/km) Average distance* (km) Fuel consumption (l) Energy consumption (MJ/l)** Total energy consumption (MJ) Vehicle Curtain- sided truck 0.34 Light commercial vehicle Medium- sized car 470 160 39 6230 0.08 470 37 39 1440 0.07 470 31 35 1090 [Allen et al., 2008 & Rankine et al. ,2006 ]
Installation and maintenance Fuel consumption (l/km) Average distance*** (km) Fuel consumption (l) Energy consumption (MJ/l)** Total energy consumption (MJ) Vehicle Light commercial vehicle 0.08 66 5 40 205 [Rankine et al. ,2006]
Total input energy Energy consumption with 50% recycled aluminium(MJ)* Energy consumption (MJ)* Component manufacure 15430 9190 Transportation 6230 6230 Installation and maintenance 205 205 Total 21870 15625 [Allen et al., 2008 & Rankine et al. ,2006 ]
Energy intensity Output energy over lifetime (MJ) Annual output (kWh) Input energy (MJ) Energy intensity 93 Hydro Wind (800 kW onshore) 19 Wind (2MW offshore) 16 Mean open micro wind turbine 870 46,980 5,320 9 Mean urban micro wind turbine 164 8,860 5,320 1.7 SWIFT rooftop wind turbine 2,500 180,000 22,630 8 Comparative micro-wind turbine (600W) Solar Natural gas Current UK grid Coal Nuclear Oil [Allen et al., Rankine et al. , Swiss centre for life cycle inventories, Ancona et al., DTI ] 4 3 0.4 0.3 0.3 0.3 0.2
Payback time Annual output energy (MJ) Input energy (MJ) Payback time (y) Mean urban micro wind turbine 590 5320 9 Mean open micro wind turbine 3130 5320 1.7 SWIFT rooftop wind turbine 9000 22630 2.5 [Allen et al., 2008 & Rankine et al. ,2006 ]
References Bahaj, A. S.,Myers, L., and James, P. A. B. Urban energy generation: influence of micro- wind turbine output on electricity consumption in buildings.EnergyBuild., 2007, 39(2), 154 165. Sahin,A.D.,Dincer, I.,andRosen,M. A.Thermodynamic analysis of wind energy. Int. J. Energy Res., 2006, 30(8), 553 566. Betz, A. Windenergie und ihre Ausnutzung durch Windm hlen, 1946 (Vandenhoek and Ruprecht, G ttingen). Entec - http://www.entec-international.com/ Roth, M. Review of atmospheric turbulence over cities. Q. J. R.Meteorol. Soc., 2000, 126, 941 990. S. R. Allen, G. P. Hammond, and M. C. McManus, Energy analysis and environmental life cycle assessment of a micro-wind turbine, J. Power and Energy, 2008, 669-683. DBERR. Energy consumption tables: domestic energy consumption tables. 2007, available from:http://www.dti.gov.uk/energy/statistics/publications/ecuk/domestic/page18071.html , accessed 13 August 2007. DCLG. Live tables on stock. 2007, available from: http://www.communities.gov.uk/index.asp?id=1156006,accessed 13 August 2007. Department of trade and industry, UK energy in brief, 2005 (DTI, London).
References Dutton, A. G., Halliday, J. A. , and Blanch, A. J., The feasibility of building- mounted/integrated wind turbines. (BUWTs): Achieving their potential for carbon emission reductions. Final report, 4 May 2005, p. 109. Ancona, D. and McVeigh, J. Wind turbine materials and manufacturing fact sheet, Prepared by Princeton Energy Resources International, LLC for the Office of Industrial Technologies, US Department of Energy,2001. Rankine, R. K., Chick, J. P. and Harrison, G. P. Energy and carbon audit of a rooftop wind turbine. Proc. InstnMech. Engrs, Part A: J. Power and Energy, 2006, 220(7),643 654 R.H. Crawford, Life cycle energy and greenhouse emissions analysis of wind turbines and the effect of size on energy yield, Renewable and Sustainable Energy Reviews 13 (2009) 2653 2660 Carbon trust - http://www.carbontrust.com/media/77248/ctc738_small- scale_wind_energy.pdf http://energy.gov/eere/wind/history-wind-energy Illustrated history of wind power development - http://energy.gov/eere/wind/history-wind- energy Swiss Centre for Life Cycle Inventories. Ecoinvent database [v1.3], 2007 (EPMA, Switzerland). DTI.Digest ofUnitedKingdomenergy statistics 2005, 2006 (Department of Trade and Industry, London). Manfred Lenzen, *, Jesper Munksgaardb, Energy and CO2 life-cycle analyses of wind turbines review and applications. Renewable energy, 26 (2002) 339 362
