Aerodynamics Lab: Wind Tunnel Turbulence Study
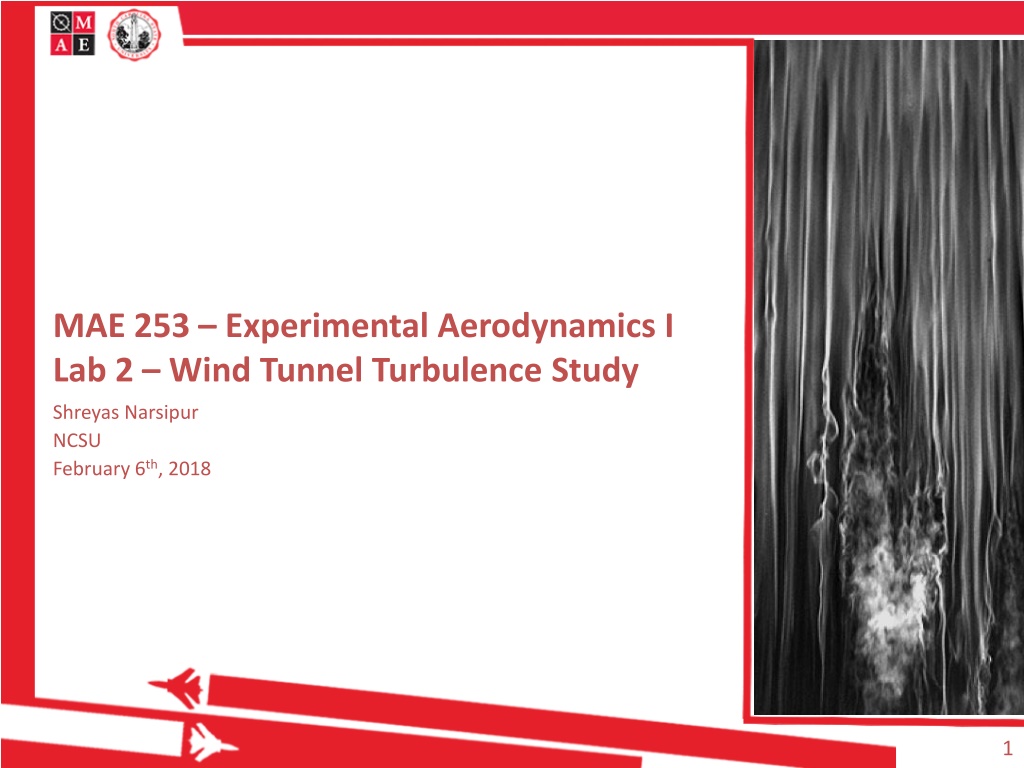
MAE 253 – Experimental Aerodynamics I
Lab 2 – Wind Tunnel Turbulence Study
Shreyas Narsipur
NCSU
February 6
th
, 2018
1
Outline
2
Lab 1 - Solutions
Lab 2 - Objective
Lab 2 – Theory
Lab 2 - Expectations
Lab 1 - Solutions
3
Lab 1 - Solutions
4
Lab 2 - Objective
5
Understand the turbulence sphere set-up for measuring
wind tunnel turbulence..
Determine the turbulence factor and per cent
turbulence of NCSU’s subsonic wind tunnel.
Lab 2 - Theory
6
What is turbulence?
–
The level of unsteady velocity fluctuations about the flow’s average
velocity.
The turbulence in a wind tunnel is mainly produced by the
propeller, the guide vanes, and the vibration of the wind tunnel
walls.
The effective Reynolds number in the test section is generally
higher than the freestream Reynolds number.
Lab 2 - Theory
7
Critical Reynolds number is the point at which flow over a bluff
body transitions from laminar to turbulent.
–
higher degree of flow attachment.
–
reduction in drag.
Flight measurements have shown that the critical Reynolds
number of a sphere in free atmosphere is 385,000 and is
independent of the turbulence structure in free air.
For a sphere, the critical Reynolds number depends on the degree
of turbulence in the wind tunnel.
–
a higher turbulence leads to faster transition.
Before the use of hot-wire anemometry,
a turbulence sphere was used to measure
relative turbulence of a wind tunnel.
Lab 2 - Theory
8
Data acquired:
Plot the variation of the pressure coefficient with Reynolds number for the
turbulence sphere.
Determine the turbulence factor of the wind tunnel.
Determine the per cent turbulence of NCSU’s subsonic wind tunnel.
Lab 2 – Expectations
9
Conduct experiments in an aerodynamics lab to study wind tunnel turbulence, understand turbulence factors, and determine turbulence percentage using specific equipment and techniques. Explore critical Reynolds numbers and methods for measuring turbulence in a controlled environment.

Download Presentation

Please find below an Image/Link to download the presentation.
The content on the website is provided AS IS for your information and personal use only. It may not be sold, licensed, or shared on other websites without obtaining consent from the author.If you encounter any issues during the download, it is possible that the publisher has removed the file from their server.
You are allowed to download the files provided on this website for personal or commercial use, subject to the condition that they are used lawfully. All files are the property of their respective owners.
The content on the website is provided AS IS for your information and personal use only. It may not be sold, licensed, or shared on other websites without obtaining consent from the author.
E N D
Presentation Transcript
MAE 253 Experimental Aerodynamics I Lab 2 Wind Tunnel Turbulence Study Shreyas Narsipur NCSU February 6th, 2018 1
Outline Lab 1 - Solutions Lab 2 - Objective Lab 2 Theory Lab 2 - Expectations 2
Lab 1 - Solutions 16 14 Isensor (mA DC) 12 10 Increasing U Linear fit (Inc) Decreasing U Linear fit (Dec) 8 6 4 0 200 400 Pmanometer (Pa) 600 800 1000 ?????????? ????????: ???????= 0.0121 ??????????+ 4.1194 ?????????? ????????:???????= 0.0121 ??????????+ 4.1501 3
Lab 1 - Solutions 16 1000 14 800 Isensor (mA DC) 12 PWT (Pa) 600 10 400 Increasing Linear fit (Inc) Decreasing Linear fit (Dec) Increasing Linear fit (Inc) Decreasing Linear fit (Dec) 8 200 6 4 0 0 200 400 PWT (Pa) 600 800 1000 0 500 1000 Pmanometer (Pa) Increasing Velocity: ???????= 0.0124 ???+ 4.0940 Increasing Velocity: ???= 0.9767 ??????????+ 2.0356 Decreasing Velocity: ???????= 0.0124 ???+ 4.0879 Decreasing Velocity: ???= 0.9729 ??????????+ 5.0159 4
Lab 2 - Objective Understand the turbulence sphere set-up for measuring wind tunnel turbulence.. Determine the turbulence factor and per cent turbulence of NCSU s subsonic wind tunnel. 5
Lab 2 - Theory What is turbulence? The level of unsteady velocity fluctuations about the flow s average velocity. The turbulence in a wind tunnel is mainly produced by the propeller, the guide vanes, and the vibration of the wind tunnel walls. The effective Reynolds number in the test section is generally higher than the freestream Reynolds number. 6
Lab 2 - Theory Critical Reynolds number is the point at which flow over a bluff body transitions from laminar to turbulent. higher degree of flow attachment. reduction in drag. Flight measurements have shown that the critical Reynolds number of a sphere in free atmosphere is 385,000 and is independent of the turbulence structure in free air. For a sphere, the critical Reynolds number depends on the degree of turbulence in the wind tunnel. a higher turbulence leads to faster transition. Before the use of hot-wire anemometry, a turbulence sphere was used to measure relative turbulence of a wind tunnel. 7
Lab 2 - Theory Critical Reynolds number of a sphere can be measured in two ways: Drag method - determine the Reynolds number at which CD = 0.30. Pressure method - obtain the critical Reynolds number at P/q = 1.22. The absence of force balances and associated calibrations to obtain drag makes the pressure method a more advantageous method than the drag option. 3.85 105 ???????? ?? = 8
Lab 2 Expectations Data acquired: Ptransducer (psf) Isensor (mA) Plot the variation of the pressure coefficient with Reynolds number for the turbulence sphere. Determine the turbulence factor of the wind tunnel. Determine the per cent turbulence of NCSU s subsonic wind tunnel. 2.5 2 % turbulence 1.5 1 0.5 0 1 1.5 2 2.5 3 9 TF