Advanced Techniques for User Identification in Transportation Using GPS and Accelerometer Data

This research focuses on transportation mode recognition and user identification by analyzing GPS and accelerometer data. The study involves data collection from varying conditions with over 500 trips and 150 hours of data, processed using spatio-temporal techniques. Features such as mean, deviation, angular features, average speed, and net distance per minute are extracted, resulting in a 49-dimensional feature vector for each minute of data. Machine learning algorithms, specifically random forest with 100 trees and a subset of 25 random features, are utilized for classification after data normalization and feature extraction. The study aims to identify active travel behaviors accurately in challenging environments.

Download Presentation

Please find below an Image/Link to download the presentation.
The content on the website is provided AS IS for your information and personal use only. It may not be sold, licensed, or shared on other websites without obtaining consent from the author.If you encounter any issues during the download, it is possible that the publisher has removed the file from their server.
You are allowed to download the files provided on this website for personal or commercial use, subject to the condition that they are used lawfully. All files are the property of their respective owners.
The content on the website is provided AS IS for your information and personal use only. It may not be sold, licensed, or shared on other websites without obtaining consent from the author.
E N D
Presentation Transcript
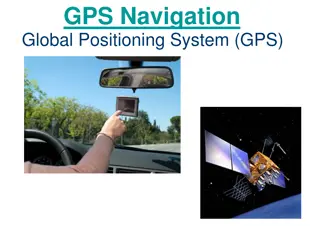
Transportation mode recognition and user identification Tomi Pietarinen 4.2.2019 1
Rossi, L. 2015. Spatio-temporal techniques for user identification by means of GPS mobility data. Ellis, K. 2014. Identifying Active Travel Behaviors in Challenging Environments Using GPS, Accelerometers, and Machine Learning Algorithms. ? ? ? ? 2 Image from http://www.vavel-project.eu/publications/%E2%96%A0-urban-travel-time-prediction-using-small-number-gps-floating-cars
Rossi, L. 2015. Spatio-temporal techniques for user identification by means of GPS mobility data. Ellis, K. 2014. Identifying Active Travel Behaviors in Challenging Environments Using GPS, Accelerometers, and Machine Learning Algorithms. ? ? ? ? 3 Image from http://www.vavel-project.eu/publications/%E2%96%A0-urban-travel-time-prediction-using-small-number-gps-floating-cars
Data collection Varying conditions 500+ trips & 150h data 1 minute windows x 2 GPS x 12 Modes: Bike, Bus, Car, Walk Sit, Stand Accelerometer 4 Image from https://www.actigraphcorp.com/support/activity-monitors/gt3xplus/ . And from http://www.qstarz.com/Products/GPS%20Products/BT-Q1000XT-F.htm
Data collection: Accelerometer and GPS GPS 15 sec epochs GPS data processed using PALMS (Personal Activity Location Measurement System) Accelerometer 30Hz x 3 axes 5400 samples per minute Data normalization 5 Image from Ellis, K. 2014. Identifying Active Travel Behaviors in Challenging Environments Using GPS, Accelerometers, and Machine Learning Algorithms.
Feature extraction Accelerometer 43 features Mean, dev, min, max Angular features GPS 6 features Average speed Net distance per minute 49 dimensional feature vector for each minute of data Total ~18000 one minute samples 6
Machine learning: Random forest 100 trees Subset of 25 random features 10 000 samples Moving average output filter Classification 7 Image from https://medium.com/@williamkoehrsen/random-forest-simple-explanation-377895a60d2d
Moving average output filter 1 minute 2 minutes 2 minutes 8 Image from Ellis, K. 2014. Identifying Active Travel Behaviors in Challenging Environments Using GPS, Accelerometers, and Machine Learning Algorithms.
Unfiltered predicted activity Filtered predicted activity True activity 9 Image from Ellis, K. 2014. Identifying Active Travel Behaviors in Challenging Environments Using GPS, Accelerometers, and Machine Learning Algorithms.
Results PREDICTED With moving average output filter: Overall accuracy 91,9% Precision 0,900 Recall 0,882 Bike Bus Car Sit Stand Walk Bike 1526 18 4 0 8 3 Bus 2 611 409 54 34 11 T R U E Car 2 127 3563 42 69 13 Sit 0 1 44 1232 186 17 Stand 5 8 8 228 2546 97 Walk 19 4 22 26 174 4228 10
Conclusion Importance score for each feature Overall high accuracy Accelerometer GPS How about mobile phones? Phone position 11
Rossi, L. 2015. Spatio-temporal techniques for user identification by means of GPS mobility data. Ellis, K. 2014. Identifying Active Travel Behaviors in Challenging Environments Using GPS, Accelerometers, and Machine Learning Algorithms. ? ? ? ? 12 Image from http://www.vavel-project.eu/publications/%E2%96%A0-urban-travel-time-prediction-using-small-number-gps-floating-cars
Datasets: GPS data Spatial resolution Temporal resolution Participant count Timespan CabSpotting 5 dec 1 s 536 30 d CenceMe 6 dec 1 h 20 2 w GeoLife 6 dec 1 s 182 70 5 1 y Only latitude, longitude and timestamp used Each GPS point a triplet (latp, longp, timep) Assumption: each person is assigned a single trace 13 Image from https://stamen.com/work/cabspotting/ . And https://www.researchgate.net/figure/CenceMe-inference-data-generated-over-a-month-across-20-subjects-in-Hanover-New_fig1_254007074. and https://www.microsoft.com/en-us/research/wp-content/uploads/2016/02/User20Guide-1.2.pdf
Method: Classification of previously seen seen points Sample of anonymized points P from a person s trace M (not removed from trace) Compare to dataset Straightforward 14 Image from https://www.researchgate.net/figure/Critical-points-marking-changes-of-spatial-relationship-Note-The-relationships-of-P1_fig3_320723148
Method: Classification of previously seen seen points Uniqueness of alternative movement information Speed Distance Average direction of travel 15 Image from https://www.researchgate.net/figure/Critical-points-marking-changes-of-spatial-relationship-Note-The-relationships-of-P1_fig3_320723148
Characterization of the uniqueness of the mobility traces m(Sn(M)) Number of traces which contain Sn(M) Lower value, more unique the trace 16 Image from Rossi, L. 2015. Spatio-temporal techniques for user identification by means of GPS mobility data.
Average uniqueness of movement information (%) Time window 30s (1h for CenceMe) 17 Image from Rossi, L. 2015. Spatio-temporal techniques for user identification by means of GPS mobility data.
Average uniqueness of spatial information (%) Coordinates: 5 decimals: area of 1,11m x 0,96m 4 decimals: area of 11,09m x 9,55m 18 Image from Rossi, L. 2015. Spatio-temporal techniques for user identification by means of GPS mobility data.
Method: Classification of previously unseen unseen points Sample of anonymized points P from a person s trace M (removed from trace) Modified Hausdorff distance 19 Image from Rossi, L. 2015. Spatio-temporal techniques for user identification by means of GPS mobility data.
Classification of previously unseen data Similarity between set of points (sample) and set of disjoint mobility traces Assumption: points belong to a single mobility trace For all the traces in dataset Repeated 100 times 20
Average classification accuracy (%) 21 Image from Rossi, L. 2015. Spatio-temporal techniques for user identification by means of GPS mobility data.
Conclusion Single spatio-temporal point or 2 spatial points sufficient for unique identification 90%+ of users Movement data (speed, distance, direction) also revealing Coarsening of gps points to reduce uniqueness Privacy concerns 22
Additional data after this slide 24
Slide 6, accelerometer & GPS features extracted Accelerometer Basic destripti statistics, eg. Min, max Skewness and Kurtosis Autocorrelation Correlation of axis pairs Entropy Angular features Principal direction of motion Autoregressive coefficients Fast Fourier Transform coefficients Total power Dominant frequency GPS Average speed Average number of satellites used an in view Average signal-to-noise ratio of satellites used and in view Net distance travelel in minute 27
Slide 20: Geometric separability index N = number on points in dataset n(p) = nearest neighbor of p f = binary function assigning a point to a class C = set of classes pc = point belonging to c in C Nc = number of above points 31
Slide 21+: Effect of training set size on the classification accuracy (Cenceme) 32
Slide 4, devices GPS: Qstarz BT1000X http://www.qstarz.com/Products/GPS%20Products/BT-Q1000X-F.htm Accelerometer: Actigraph GT3X+ https://www.actigraphcorp.com/support/activity-monitors/gt3xplus/ 33


")
")


")