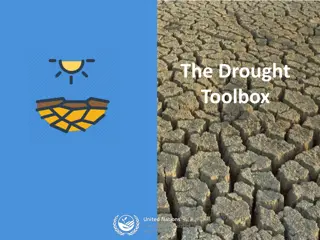
2022 Update on Drought Risk Assessment Tool
Explore the latest data and insights on drought conditions, reservoir modeling, and at-risk capacity in the August 2022 update of the Drought Risk Assessment Tool. Discover comparisons between summer 2011 and 2022, improvements for groundwater aquifer modeling, and the impact of different weather forecasts on reservoirs. Stay informed on monitoring trends, percentage of the state under drought, and updates to the Drought Risk Model vis-a-vis the U.S. Drought Monitor's Exceptional Drought Metric.

Download Presentation

Please find below an Image/Link to download the presentation.
The content on the website is provided AS IS for your information and personal use only. It may not be sold, licensed, or shared on other websites without obtaining consent from the author. If you encounter any issues during the download, it is possible that the publisher has removed the file from their server.
You are allowed to download the files provided on this website for personal or commercial use, subject to the condition that they are used lawfully. All files are the property of their respective owners.
The content on the website is provided AS IS for your information and personal use only. It may not be sold, licensed, or shared on other websites without obtaining consent from the author.
E N D
Presentation Transcript
Drought Risk Assessment Tool August 2022 update Dan Mantena Resource Adequacy 8/29/22
Topics Drought conditions (Summer 2011 vs. Summer 2022) August 2022 update Modeling of reservoirs under drought conditions overview Results of the recent generator water RFI survey Discuss improvements for tool Groundwater aquifers modeling 2 PUBLIC
Drought Conditions (Summer 2011 vs. Summer 2022) https://droughtmonitor.unl.edu/Maps/CompareTwoWeeks.aspx 3 PUBLIC
August 2022 Update of the Drought Risk Model https://www.ercot.com/gridinfo/resource 4 PUBLIC
August 2022 At-risk Capacity for 18-MonthTime Horizon under Different Weather Forecasts 5 PUBLIC
Modeling of Reservoirs under Drought Conditions The model use a Drought Fit prediction by simulating monthly storage level changes in times of drought. For most reservoirs, the level of the 30th percentile is used to forecast monthly usage. Short-term Weather forecast introduced into model at the end of 2019 consists of a single qualitative descriptor for the upcoming 3 months based on temperature and precipitation outlooks for the state provided by ERCOT s meteorologist. A wet weather forecast reflects the 75% percentile of monthly changes in storage for the upcoming 3 months. A normal weather forecast reflects the 50% percentile of monthly changes in storage for the upcoming 3 months. A dry weather forecast reflects the 25% percentile of monthly changes in storage for the upcoming 3 months. A Normal forecast was used for Fall 2022 in the August update. 6 PUBLIC
Percentage of State under Drought Conditions from U.S. Drought Monitor https://droughtmonitor.unl.edu/About/AbouttheData/DSCI.aspx 7 PUBLIC
Drought Risk Model Updates Compared to U.S. Drought Monitor Exceptional Drought Metric 9 PUBLIC
Results of Recent Generator RFI survey Validation Results Modeling Accurate Modeling Inaccurate Did not respond to RFI Grand Total # of Units 374 54 48 476 2021 MWh Generation 281,383,296 297,226,462 79% 11% 10% 95% 2% 3% 6,854,919 8,988,247 Most units with inaccurate water source modeling were for units that relied on groundwater wells. 10 PUBLIC
Next Steps: Revisit Modeling of Groundwater Aquifers Groundwater Aquifer Carrizo Edwards Gulf Coast Ogallala Pecos Valley Total Depth Current Depth % Storage 91.3% 70.5% 85.0% 45.2% 52.9% Total MW Zone Total MWh 4,246,761 10,018,986 5,190,125 (1,740) (288) (440) (82) (325) (151) (85) (66) (45) (153) 719 184 SOUTH; HOUSTON WEST; SOUTH SOUTH WEST WEST 83,001 2,790 2,073 320 67,095 Current modeling relies on a single well to represent each of aquifer using data from here: https://www.waterdatafortexas.org/groundwater A more targeted RFI survey to owners that use groundwater wells for plant operations could provide more accurate modeling (state well numbers). 11 PUBLIC
Appendix Additional related documents and public drought risk reports can be found under the Drought Risk section of the ERCOT Resource Adequacy page https://www.ercot.com/gridinfo/resource Dmantena@ercot.com 12 PUBLIC


")