Understanding Functional Form Fitting in Data Analysis
Explore the intricacies of fitting different functional forms to data sets, considering error bars and weight factors. The analysis covers fitting to various models such as A=a+bT, A=a/(1+bT), 1/A=a+bT, 1/A=a+BT, fitting ln(A)=1+bT, and flipping axes to handle thickness errors more effectively. Key metrics like R2, reduced chi-squared, and intercept values are discussed, offering insights into data interpretation and modeling techniques.
Download Presentation

Please find below an Image/Link to download the presentation.
The content on the website is provided AS IS for your information and personal use only. It may not be sold, licensed, or shared on other websites without obtaining consent from the author. Download presentation by click this link. If you encounter any issues during the download, it is possible that the publisher has removed the file from their server.
E N D
Presentation Transcript
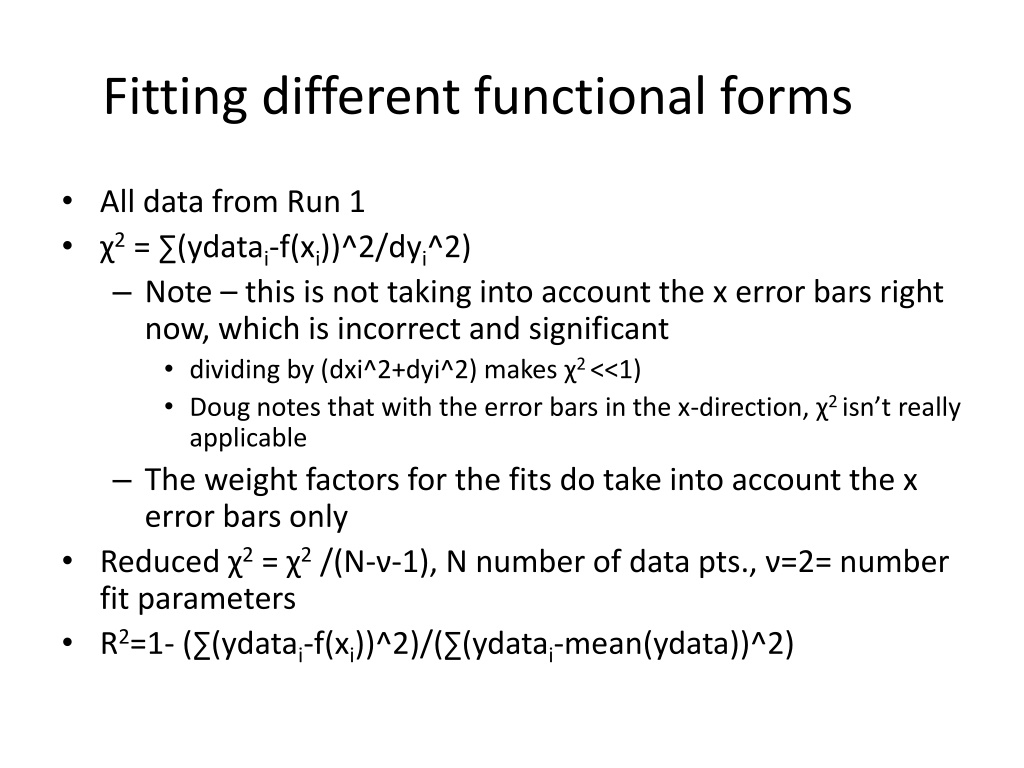
Fitting different functional forms All data from Run 1 2= (ydatai-f(xi))^2/dyi^2) Note this is not taking into account the x error bars right now, which is incorrect and significant dividing by (dxi^2+dyi^2) makes 2 <<1) Doug notes that with the error bars in the x-direction, 2 isn t really applicable The weight factors for the fits do take into account the x error bars only Reduced 2= 2/(N- -1), N number of data pts., =2= number fit parameters R2=1- ( (ydatai-f(xi))^2)/( (ydatai-mean(ydata))^2)
Summary: plotting vs. thickness R2 red. 2 function intercept dA A=a+bx 43.8892 0.08773 0.98205 49.7433 A=a/(1+bx) 44.0285 0.07535 0.996117 9.63821 1/A=1+bx 44.0228 0.07657 0.995858 9.87618 1/sqrt(A)= a+bx 43.9853 0.01930 0.996103 9.27312 ln(A)=a+bx 43.9507 0.07976 0.993937 14.1665
Now, flip axes to handle thickness error more tidily All data from Run 1 2= (ydatai-f(xi))^2/dyi^2) Now the bigger error bars are in both the weights and the Chi squaredReduced 2= 2 /(N- -1), N number of data pts., =2= number fit parameters R2=1- ( (ydatai-f(xi))^2)/( (ydatai-mean(ydata))^2)
Summary: plotting vs. thickness R2 red. 2 function intercept dA A=a+bx 43.9096 1.85391 0.979663 3.3537 reject A=a/(1+bx) 1/A=1+bx 44.0356 1.42618 0.995821 1.76053 1/sqrt(A)= a+bx 43.999 2.96764 0.995412 1.97557 ln(A)=a+bx 43.9661 5.94047 0.992497 2.31988 nearly reject
Compare two most likely 1/A = a + bT is functionally the same as A=a/(1+bT) Very different uncertainties: check correlation matrices? 1 -0.999 1 -0.593 -0.999 1 -0.593 1
