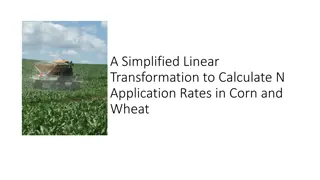
Effect of Sulfur Fertilization on Nitrogen Use Efficiency for Spring Wheat and Corn
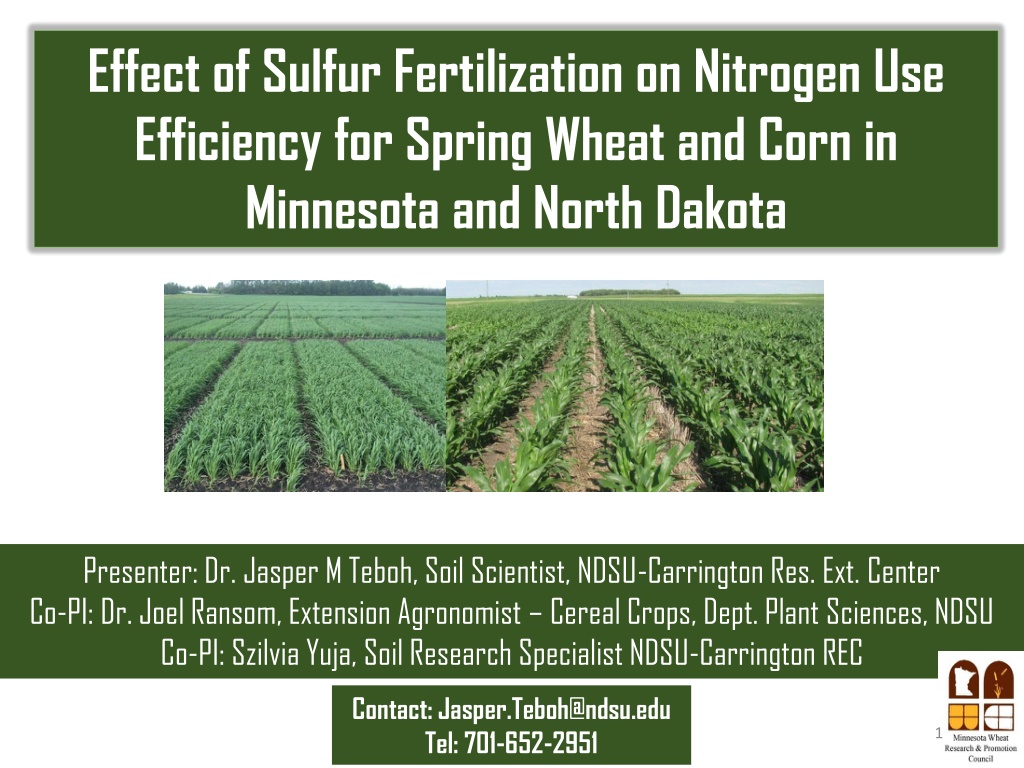
This research project, conducted by Dr. Jasper M. Teboh and his team at NDSU, investigates the impact of sulfur fertilization on nitrogen use efficiency for spring wheat and corn in Minnesota and North Dakota. The study aims to determine if wheat or corn respond to sulfur application, how sulfur affects the nitrogen use efficiency of wheat, and how responses may vary across different soil types. The research includes field trials with varying nitrogen and sulfur rates, along with analysis of wheat grain yield and protein response to nitrogen and sulfur treatments.

Download Presentation

Please find below an Image/Link to download the presentation.
The content on the website is provided AS IS for your information and personal use only. It may not be sold, licensed, or shared on other websites without obtaining consent from the author. Download presentation by click this link. If you encounter any issues during the download, it is possible that the publisher has removed the file from their server.
E N D
Presentation Transcript
Effect of Sulfur Fertilization on Nitrogen Use Efficiency for Spring Wheat and Corn in Minnesota and North Dakota Presenter: Dr. Jasper M Teboh, Soil Scientist, NDSU-Carrington Res. Ext. Center Co-PI: Dr. Joel Ransom, Extension Agronomist Cereal Crops, Dept. Plant Sciences, NDSU Co-PI: Szilvia Yuja, Soil Research Specialist NDSU-Carrington REC Contact: Jasper.Teboh@ndsu.edu Tel: 701-652-2951 1
RESEARCH QUESTIONS RESEARCH QUESTIONS 1. Would wheat or corn respond to S application? If so, 2. How would wheat response to S affect NUE of wheat? 3. How might responses differ from one soil to another? 2
Materials and Methods and Methods Materials Rates in North Dakota were, N Rates: 0, 50, 100, 150, 200 lbs/ac; and S Rates: 0, 10, 20, lbs/ac Split-plot RCBD, replicated four times 10 240 0 20 240 0 10 180 20 180 20 60 0 60 10 60 0 10 120 20 120 0 0 20 0 10 0 240 180 120 401 402 403 404 405 406 407 408 409 410 411 412 413 414 415 0 60 10 60 20 60 0 10 120 20 120 10 0 0 0 20 0 0 10 240 20 240 10 180 0 20 180 120 240 180 301 302 303 304 305 306 307 308 309 310 311 312 313 314 315 Border Border 20 180 0 10 180 0 0 10 0 20 0 0 10 240 20 240 0 60 20 60 10 60 20 120 0 10 120 180 240 120 201 202 203 204 205 206 207 208 209 210 211 212 213 214 215 0 0 10 0 20 0 0 60 10 60 20 60 0 10 120 20 120 0 10 180 20 180 0 10 240 20 240 120 180 240 101 102 103 104 105 106 107 108 109 110 111 112 113 114 115
Locations of Trials Williston Minot EGF TRF RLF Ada CREC Forman Map Courtesy: http://geology.com/county-map/minnesota.shtml
RESULTS Analysis of Variance for wheat grain yield and protein in response to N and S in MN (2015, 2016) Effect SOV N rate (N) <0.0001 <0.0001 <0.0001 S rate (S) 0.0004 N x S 0.59 N rate 0.2726 S rate 0.2529 N x S 0.2035 N rate S rate N x S N rate 0.51 S rate 0.51 N x S 0.94 2015 2016 SOM (%) Soil Type Site Yield Protein Yield Protein <0.0001 0.831 0.7063 Sandy Loam Ada 0.0435 0.7622 0.0067 0.5038 0.6340 2.6 0.6094 0.5705 Silty Clay Loam EGF 3.7 0.028 0.441 0.631 0.003 <.0001 0.1908 <.0001 0.9974 0.3255 <.0001 0.5785 0.1645 Loam RLF 3.6 <.0001 0.0456 0.3622 TRF 2.3 Sandy Loam 5
Yield response of HRS wheat to N rates at three S rates, averaged across 6 site years 75 70 Yield (bu/ac) 65 60 0lbs S 10lb S 20lb S 55 50 0 60 120 180 240 N Rates 6
Yield response of spring wheat to N rates at three S levels, averaged across four site years 75 70 Yield (bu/ac) 65 60 55 50 0 60 120 180 240 N Rates (lbs N/ac)
Agronomic Efficiency of N at three S levels for wheat (Ada, MN, 2016) 0lbs S 10lbs S 20lbs S 0.03 AEN (bu gain/lb N) 0.02 0.02 0.01 0.01 0.00 60 120 180 240 -0.01 -0.01 Nrate (lb/ac)
AEN of N at three S levels for HRS wheat (Ada, MN, 2015) 0.60 AEN (bu gain/lb N) 0lbs S 10lbs S 20lbs S 0.40 0.20 0.00 60 120 180 240 N Rate (lb/ac)
Agronomic efficiency of N at three S levels (TRF, MN, 2016) 0.40 0lbs S 10lbs S 20lbs S AEN (bu gain/lb N) 0.30 0.20 0.10 0.00 60 120 180 240 Nrate (lb/ac)
Impact of S (0, 10, 20 lbs S/a) on N rate, needed to maximize wheat yield ( 70 bu/ac) and protein ( 14.5%) grain yield and protein (lb/a) N Rates needed to maximize 250 200 Protein maxed at Yield maxed at 69 bu/a Protein maxed at Yield maxed at 70 bu/a Yield maxed at 69 bu/a Protein maxed at 150 14.47% 14.59% 14.55% 100 50 0 S Rates (lb/a) 0 10 180 183 20 161 181 N rate to max yield N rate to max protein 185 228 11
RATES OF N NEEDED TO MAXIMIZE YIELD AND PROTEIN OF WHEAT AT THREE S LEVELS (AT ADA AND TRF, MN; 2015 AND 2016) N rate to maximize yield and protein 300 250 13.88% 14.22% 200 14.30% 74 bu 74 bu (lbs/a) 150 69 bu 100 50 0 Yield max level 161 194 188 Protein max level 255 193 223 0 10 20
Analysis of Variance for wheat grain yield and protein in response to N and S in North Dakota (2015, 2016) Effect 2015 2016 SOM (%) SOV Site Soil Type Yield 0.5106 0.6852 0.1562 <.0001 0.0015 <.0001 Protein <.0001 0.0705 0.9328 0.0997 0.273 0.253 Yield 0.9271 0.5063 0.3969 0.0002 Protein <.0001 0.9611 0.8743 0.0028 N rate S rate N x S Loam CREC 4.2 N rate S rate N x S N rate S rate N x S N rate S rate N x S Silty Clay Loam MINOT 0.2558 0.0006 0.1053 0.6857 0.9738 0.1507 0.0002 0.988 0.819 0.9139 <.0001 0.1651 0.1845 <.0001 0.0049 0.0001 3.7 Loam Forman 3.6 Sandy Loam Williston REC 2.3
AEN of N at three S levels (Minot, ND, 2016) 0lbs S 10lbs S AEN (bu gain/unit of added N) 1.00 0.80 0.60 0.40 0.20 0.00 50 0.05 0.58 0.77 100 0.07 0.84 0.74 150 0.05 0.87 0.81 200 0.09 0.60 0.60 0lbs S 10lbs S 20lbs S Nrate (lb/ac)
Agronomic efficiency of N at three S levels (Minot, ND. 2016) 0lbs S AEN (bu gain/unit of added N) 0.15 0.10 0.05 0.00 50 100 150 200 Nrate (lb/ac) -0.05
Agronomic Efficiency of N at three S levels (Two-year average for Minot, ND) AEN (bu gain/unit of added N) 0.30 0lbs S 0.25 10lbs S 0.20 20lbs S 0.15 0.10 0.05 0.00 50 100 150 200 Nrate (lb/ac)
Agronomic Efficiency of N at three S levels (Williston, ND) AEN (bu gain/unit of added N) 0lbs S 0.10 10lbs S 20lbs S 0.05 0.00 -0.05 60 0.03 0.09 0.06 100 0.03 0.06 0.02 140 0.01 0.02 0.01 180 -0.02 0.02 -0.01 0lbs S 10lbs S 20lbs S Nrate (lb/ac)
Corn Corn yield response to S at yield response to S at Forman, ND (2016) Forman, ND (2016)
Materials Materials and Methods and Methods Trt 1 2 3 4 5 6 7 8 9 10 11 S-rate 0 10 20 30 40 0 10 20 30 40 0 N-rate 210 210 210 210 210 105 105 105 105 105 0
RESULTS CORN YIELD RESPONSE TO N AVERAGED ACROSS S RATES (FORMAN, 2016) a 300 b Yield, bu/ac 200 c 100 0 N, lb/a 0 105 219 210 259 Yield 122
CORN YIELD RESPONSE TO S RATES AT TWO N LEVELS (FORMAN, 2016) 300 a ab ab abc bcd bcd 250 cd cd cd d 200 Yield (bu/ac) 150 e 100 50 0 S0 N0 S0 S10 S20 S30 S40 S0 S10 S20 S30 S40 S lb/ac N lb/ac N105 N105 N105 N105 N105 N210 N210 N210 N210 N210 207 221 217 233 219 bu/ac 122 234 266 276 263 265
Corn yield response to S at recommended N rate of 210 lbs (Forman, 2016) a 280 ab ab 270 ab 260 Yield, bu/ac 250 240 b 230 220 210 0 10 266 20 276 30 263 40 265 Lbs S/ac) Yield 234 Means with the letters are not signifcantly different p< 0.05
Agronomic efficiency of S for corn at two N rates 3.5 Unit bushel produced 3.0 per lb of added S 105 Lbs N 2.5 210 Lbs N 2.0 1.5 1.0 0.5 0.0 10 15 20 25 30 35 40 S rates (lbs/ac)
SUMMARY SUMMARY Wheat response to sulfur was weak in soils with SOM less > 3.5% The amount of N needed to maximize yield and protein was less with S application, suggesting S improved NUE Agronomic efficiency of N was improved with S application to wheat at S responsive Sulfur application increased corn yields by at least 21 bushels Agronomic efficiency of S was higher when adequate, or close to adequate N was available to corn Soil organic matter is likely a key determinant (including climatic factors) to the effect of S on wheat response
ACKNOWLEDGEMENT The Minnesota Wheat and Promotion Council Producers: Mr. Pete Kappes; Mr. Ken Asp; Mr. John Barrett (East GF) Technicians: Russ Severson, Bill Craig, Nathan Johnson Grad students: Melissa Geiszler, Matthew Rellaford, Nicholas Schimek Researchers: Mr. Chad Deplazes (Research Specialist, NDSU); Drs. Grant Mehring, Gautam Pradhan, and Dan Kaiser Lauren Proulx Katie Kainz Dave Torgerson Kaylina Paulley 25


 on N rate, needed to")


")