Cover Crop Nitrogen Availability Calculator
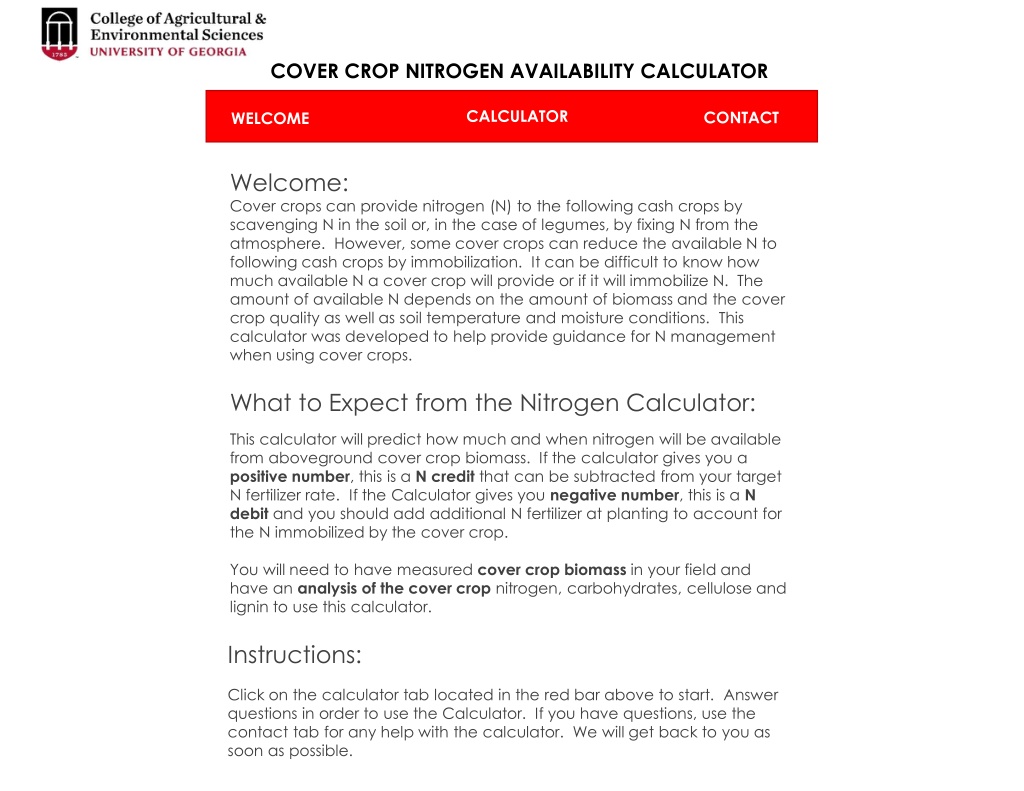
Cover crops can impact nitrogen availability for cash crops. This calculator helps estimate nitrogen availability from cover crop biomass, guiding N management decisions. It requires data on cover crop biomass and composition. Positive values suggest a nitrogen credit, while negative values indicate a nitrogen debit, prompting adjustments in fertilizer application. Detailed instructions and input requirements are provided for accurate results.
Download Presentation

Please find below an Image/Link to download the presentation.
The content on the website is provided AS IS for your information and personal use only. It may not be sold, licensed, or shared on other websites without obtaining consent from the author.If you encounter any issues during the download, it is possible that the publisher has removed the file from their server.
You are allowed to download the files provided on this website for personal or commercial use, subject to the condition that they are used lawfully. All files are the property of their respective owners.
The content on the website is provided AS IS for your information and personal use only. It may not be sold, licensed, or shared on other websites without obtaining consent from the author.
E N D
Presentation Transcript
COVER CROP NITROGEN AVAILABILITY CALCULATOR CALCULATOR CONTACT WELCOME Welcome: Cover crops can provide nitrogen (N) to the following cash crops by scavenging N in the soil or, in the case of legumes, by fixing N from the atmosphere. However, some cover crops can reduce the available N to following cash crops by immobilization. It can be difficult to know how much available N a cover crop will provide or if it will immobilize N. The amount of available N depends on the amount of biomass and the cover crop quality as well as soil temperature and moisture conditions. This calculator was developed to help provide guidance for N management when using cover crops. What to Expect from the Nitrogen Calculator: This calculator will predict how much and when nitrogen will be available from aboveground cover crop biomass. If the calculator gives you a positive number, this is a N credit that can be subtracted from your target N fertilizer rate. If the Calculator gives you negative number, this is a N debit and you should add additional N fertilizer at planting to account for the N immobilized by the cover crop. You will need to have measured cover crop biomass in your field and have an analysis of the cover crop nitrogen, carbohydrates, cellulose and lignin to use this calculator. Instructions: Click on the calculator tab located in the red bar above to start. Answer questions in order to use the Calculator. If you have questions, use the contact tab for any help with the calculator. We will get back to you as soon as possible.
COVER CROP NITROGEN AVAILABILITY CALCULATOR WELCOME CONTACT CALCULATOR Please answer the questions below. Click Next Page to continue. Background: Please enter the field name To chose the closest weather station, what county is your farm located in? (OR Choose interactive map here) What is the CASH crop? What is the planting date? (dd/mm/yyyy) What is your target nitrogen fertilizer rate? (If unknown, see crop recommendation sheet for specific crops here) lbs N/acre What is the COVER CROP? When will the cover crop be killed or incorporated? Is this a high organic matter soil? (Soils that have been managed using conservation tillage with cover crops or organic for at least three years) NEXT PAGE
COVER CROP NITROGEN AVAILABILITY CALCULATOR WELCOME CALCULATOR CONTACT Please answer the questions below and click Next Page when complete: Background: The cover crop residue will be incorporated? (Y or N) The cover crop residue will be left on the surface? (Y or N) Was the cover crop residue analyzed by the Agricultural and Environmental Services Labs? If so, please enter the Lab. No. IF NO, leave blank and enter data from another laboratory on the section below. Lab No. lbs/acre Dry cover crop biomass 0-100% Nitrogen in cover crop Carbohydrates in cover crop 0-100% 0-100% Cellulose in cover crop 0-100% Lignin in cover crop Carbohydrates + Cellulose + Lignin should equal 100% NEXT PAGE PREVIOUS
COVER CROP NITROGEN AVAILABILITY CALCULATOR CONTACT CALCULATOR WELCOME Is this information correct? Field Name: Weather Station: Cash Crop: Cash Crop Planting Date: Target Nitrogen Fertilizer Rate: Cover Crop: Cover Crop Termination Date: High Organic Matter Soil: Cover crop residue was: Dry Cover Crop Biomass: Nitrogen in Cover Crop: Carbohydrates in Cover Crop: Cellulose in Cover Crop: Lignin in Cover Crop: NO RETURN TO PREVIOUS RUN MY MODEL
COVER CROP NITROGEN AVAILABILITY CALCULATOR CONTACT WELCOME CALCULATOR RESULTS: Field Name and Sample # Your cover crop was put cover crop here terminated on . The cover crop is predicted to release lbs of N per acre from the aboveground biomass over months. This is a N credit or debit The cover crop is predicted to release: lbs of N per acre in the first two lbs of N per acre in the first four two weeks after termination. four weeks after termination. Your target nitrogen fertilizer rate was lbs N/ac. Your recommended N after the cover crop is: lbs N/ac. The available N reported above from the cover crop decompositions is considered a N credit if positive or a debit if negative. The amount of N fertilizer recommended may be reduced by a credit or increased by a debit. Here are examples: N Debit Example: N Debit Example: Recommended or Target N = 150 lbs N/ac Predicted Cover Crop N = - - 20 lbs N/ac Recommended N after Credit = 150- (-20) = 150 +20 = 170 lbs N/ac N Credit Example: N Credit Example: Recommended or Target N = 150 lbs N/ac Predicted Cover Crop N = 50 lbs N/ac Recommended N after Credit = 150-50= 100 lbs N/ac 100 lbs N/ac 170 lbs N/ac NEXT PAGE PREVIOUS
COVER CROP NITROGEN AVAILABILITY CALCULATOR CONTACT WELCOME CALCULATOR RESULTS: Field Name and Sample # In addition to the amount of available N released from your cover crop, when it is released is important to guide your N management. This graph will give you an idea about when the N is being released. Days after cover crop termination is on the horizontal axis and amount of available N on the vertical axis. To determine how much available N will be available at a given time, follow a vertical line up from a date to the plotted curve. Plant Available N lb/acre The steepness of the plotted line indicates how rapidly N is released. This graph may help you decide if you want to adjust your N fertilizer at planting or sidedress. PLANT DATE FINISHED PREVIOUS
COVER CROP NITROGEN AVAILABILITY CALCULATOR CONTACT WELCOME CALCULATOR For questions about how to use the calculator, contact your county agent. Additional information can be found in the following Extension publications: Predicting Nitrogen Release from Cover Crops: the Cover Crop Nitrogen Availability Calculator - extension.uga.edu/publications/detail.html? number=B1466 Cover Crop Biomass Sampling - extension.uga.edu/publications/detail.html? number=C1077
