
CCFIT 124 Enterprise Systems
Data and process modeling concepts and tools, including data flow diagrams and process descriptions. Understand the symbols and rules for creating data flow diagrams and how to draw them in a sequence from general to specific.
0 views • 21 slides

The Psychology of Flow: Achieving Total Focus and Optimal Performance
Engage in activities for their intrinsic value, where the ego diminishes, and time seems to vanish - that's when flow occurs. This optimal psychological state involves deep concentration, clear goals, and a sense of control. By embracing challenges and staying in the present moment, one can cultivat
0 views • 13 slides

Understanding Runoff in Hydrology
Runoff in hydrology refers to surface water flow from precipitation and other sources in drainage basins. It plays a crucial role in stream flow and peak flood formation, influenced by factors like overland flow, interflow, and groundwater flow. This article explores the sources of runoff, including
3 views • 27 slides

Understanding Max Flow in Network Theory
In network theory, understanding the concept of maximum flow is crucial. From finding paths to pushing flow along edges, every step contributes to maximizing the flow from a source to a target in the graph. The process involves determining capacities, creating flows, and calculating the net flow ent
2 views • 41 slides

The Joy of Sets: Graphical Alternatives to Euler and Venn Diagrams
Graphical representations of set membership can be effectively portrayed using alternatives to traditional Euler and Venn diagrams. Learn about upset plots, indicating set membership graphically, and the use of Venn or Euler diagrams as solutions. Explore the historical context and challenges with V
2 views • 43 slides

Fire Flow Requirements and Calculation Methods
Detailed information on site fire flow and hydrant flow testing requirements, how to calculate required fire flow, applicable codes and standards including NFPA and IBC, duration of fire flow, methodologies for fire flow calculation, and ISO methods and formulas.
4 views • 30 slides
Exploring Spaghetti Diagrams in STEM Education for Grades K-5
Dive into the world of Spaghetti Diagrams through industrial engineering concepts taught in a Toyota Production Systems Lab for students in Grades K-5. Understand the flow of movement in spaces like houses, learn to create spaghetti diagrams, and discover how they can be applied to rearrange rooms a
0 views • 20 slides

Business Mathematics: Various Bar Diagrams and Charts Explained
This comprehensive guide covers the concepts of sub-divided bar diagrams, duo-directional bar diagrams, sliding bar diagrams, and pie charts in Business Mathematics. It includes definitions, examples, and solutions to help understand how to represent data effectively using these graphical tools. Ms.
0 views • 15 slides

Network Diagrams for Resource Management Techniques
Examples of network diagrams and arrow diagrams for different relationships in resource management techniques are provided. The diagrams illustrate activity sequences, dependencies, and solutions for various scenarios. These visual representations aid in planning, scheduling, and managing resources
1 views • 6 slides

Understanding UML Sequence Diagrams and Their Applications
UML sequence diagrams depict how objects interact in a given scenario, showcasing messages sent between targets on lifelines. They are valuable for detailing use cases, modeling logic, task flow between components, and understanding process functionality. Objects, boundaries, controls, and stereotyp
1 views • 30 slides

Understanding Structured Analysis in Software Design
Structured analysis in software design aims to describe customer requirements, create a basis for software design, and define validatable requirements. Two main modeling philosophies, structured analysis, and object-oriented analysis are discussed. Structured Analysis Model Elements such as Data Flo
1 views • 44 slides

Importance of Cash Flow Analysis in Financial Management
Cash flow analysis is a crucial financial tool for effective cash management, aiding in evaluating financial policies and positions. It helps in planning, coordinating financial operations, assessing cash needs, and meeting obligations. However, it has limitations as it does not substitute the incom
1 views • 7 slides

Understanding the Importance of Flow Charts in System Processes
Flow charts are valuable tools that visually represent the flow of data and process steps within a system. They help define problems, sequence steps to solve them, and show alternatives if issues arise. By using standard symbols, flow charts facilitate communication between engineers and clients, ai
1 views • 35 slides

Understanding Fluid Flows in Fluid Mechanics
Fluid Mechanics is the study of fluids in motion or at rest, and their interactions with solids or other fluids. Fluid flows are classified based on various characteristics such as viscous versus inviscid regions, internal versus external flow, compressible versus incompressible flow, laminar versus
1 views • 16 slides

Understanding Flow Monitoring in OVS for Efficient Network Management
Learn how Flow Monitoring in Open vSwitch (OVS) allows controllers to track and manage changes to flow tables, enabling efficient network management. Explore topics such as Flow Mod programming, Flow Monitor messages, OVS support, monitoring vs. snoop, and practical examples of flow monitoring in ac
0 views • 9 slides

Understanding Energy Transfers with Sankey Diagrams
Sankey diagrams are visual tools that depict energy transfers within a system, offering insights into efficiency and energy distribution. By examining the width of arrows representing energy flow, one can analyze useful and wasted energy outputs. Inefficient systems show a disproportionate amount of
1 views • 9 slides

Understanding Feynman Diagrams in Particle Physics
Feynman diagrams, developed by Richard Feynman in the 1940s, are a graphical technique to represent particle interactions in space-time. These diagrams use lines to depict particles, with fermions moving forward in time and antifermions moving backward. Vertices in the diagrams represent points wher
1 views • 19 slides

Water Management Plans for Healthcare Facilities - Process Flow Diagrams
Editable water system process flow diagrams for healthcare facilities based on recommendations from CDC and ASHRAE. Includes instructions for customization and samples for various water flow scenarios. Ensures facilities can create customized diagrams tailored to their specific needs for effective w
1 views • 7 slides

Understanding Flow Chemistry for Efficient Chemical Reactions
Flow chemistry, also known as continuous flow or plug flow chemistry, revolutionizes chemical reactions by running them in a continuous flow stream. This dynamic process offers efficient manufacturing of chemical products with precise control over critical parameters like stoichiometry, mixing, temp
2 views • 7 slides

Understanding Open Channel Flow and Mannings Equation
This review covers hydraulic devices such as orifices, weirs, sluice gates, siphons, and outlets for detention structures. It focuses on open channel flow, including uniform flow and varied flow, and explains how to use Mannings equation for calculations related to water depth, flow area, and veloci
1 views • 43 slides

Overview of Loop Diagrams in Process Control Systems
Loop diagrams are essential documents in process control systems, providing schematic representations of hydraulic, electric, magnetic, or pneumatic circuits. They detail instrumentation arrangements, signal connections, power connections, and termination information. Guidelines and standards for cr
1 views • 5 slides

Various Quality Improvement Diagrams for Root Cause Analysis
Explore a series of quality improvement diagrams such as fishbone diagrams, cause-and-effect flow charts, error reduction improvement diagrams, and root cause analysis steps. These visual tools offer insights into identifying and addressing root causes of issues in different processes or systems.
0 views • 12 slides

Examples of Data Flow Diagrams (DFD) in Business Processes
Explore various examples of Data Flow Diagrams (DFD) showcasing the flow of information in different business processes such as air line reservation, payroll systems, old car mart operations, and book supplier workflows. These visual representations illustrate the sources, processing, and sinks of d
0 views • 10 slides

Key Driver Diagrams in Continuous Quality Improvement
Key Driver Diagrams are essential tools in Continuous Quality Improvement (CQI) to help organizations achieve their goals by identifying key drivers and their relationships. These diagrams aid in understanding complex systems, setting SMART aims, and implementing effective change strategies. Through
0 views • 24 slides

Understanding Max-Flow and Min-Cut Problems in Graph Theory
This collection covers the concepts of max-flow and min-cut in directed graphs, focusing on moving water or data packets from a source to a target vertex within given capacities. It explains flow values, finding optimal solutions, and strategies for maximizing flow networks. The visuals aid in grasp
0 views • 58 slides
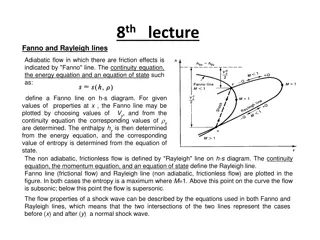
Understanding Fanno and Rayleigh Lines in Adiabatic Flow
Fanno and Rayleigh lines on the h-s diagram help in analyzing adiabatic flow with friction effects. The Fanno line represents frictional flow, while the Rayleigh line signifies non-adiabatic, frictionless flow. These lines aid in plotting flow properties and understanding phenomena like shock waves
0 views • 6 slides

Understanding Activity Diagrams and State Chart Diagrams
Activity diagrams describe the workflow behavior of a system by showing the sequence of activities performed, including conditional and parallel activities. Elements such as Initial Activity, Symbol Activity, Decisions, Signals, Concurrent Activities, and Final Activity are depicted in these diagram
0 views • 10 slides

Understanding UML Package Diagrams and Components in Software Design
UML package diagrams are essential in organizing model elements such as use cases and classes into groups for a better structure in system modeling. They help in providing a high-level overview of requirements and architecture, logically modularizing complex diagrams, and indicating dependencies bet
0 views • 38 slides
Understanding Activity Diagrams in Object-Oriented Modeling
Activity diagrams in object-oriented modeling show the sequence of steps in a complex process, such as an algorithm or workflow. They depict the flow of control, including sequential and concurrent paths. These diagrams are essential during the early stages of designing algorithms and workflows, ill
0 views • 13 slides

Understanding Testing in Software Engineering
In the previous session, we discussed various aspects of software engineering, including modeling with UML diagrams, such as activity diagrams, use case diagrams, sequence diagrams, state diagrams, and class diagrams, as well as architecture patterns. Testing was emphasized as a key aspect, highligh
0 views • 35 slides
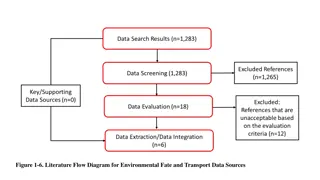
Comprehensive Literature Flow Diagrams and Bibliographies on Environmental Fate, Transport, Release, and Exposure Data Sources
This compilation features detailed literature flow diagrams and bibliographies outlining data sources and evaluations related to environmental fate, transport, release, occupational exposure, consumer exposure, and hazard assessments. The diagrams provide insights into the interconnected pathways of
0 views • 13 slides
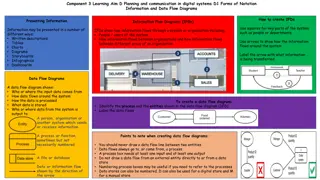
Understanding Information and Data Flow Diagrams in Digital Systems
Explore the creation and utilization of Information Flow Diagrams (IFDs), Data Flow Diagrams (DFDs), and Flowcharts in digital systems. Learn how these visual representations illustrate the flow of information, data processing, and system interactions, aiding in effective planning and communication.
0 views • 4 slides

Understanding UML Activity Diagrams in Software Design
UML Activity Diagrams provide a modern way to visualize business processes, workflows, data flows, and complex algorithms in software systems. They use symbols to represent different parties involved, actions performed, transitions, and control flows. These diagrams help in modeling data flows, obje
0 views • 14 slides
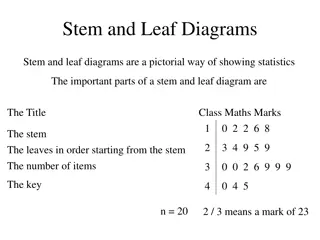
Exploring Stem and Leaf Diagrams for Statistical Analysis
Stem and leaf diagrams provide a visual way to represent statistical data effectively. This article showcases examples of stem and leaf diagrams for various datasets, including math marks, pulse rates, pocket money, speeds of cars, distances in meters, and comparison between two classes. The diagram
0 views • 6 slides
Understanding Sequence Diagrams in Software Development
Sequence diagrams depict the sequence of actions in a system, capturing the invocation of methods in objects. They are a valuable tool for representing dynamic system behavior. Message arrows in sequence diagrams indicate communications between objects, illustrating synchronous and asynchronous mess
0 views • 21 slides
Understanding Venn Diagrams and Categorical Syllogisms
Venn diagrams, introduced by John Venn, visually represent relationships between different classes. Shading in diagrams signifies empty sets or no overlap between classes. Different types of categorical statements such as universal and particular are illustrated using examples. Explore how Venn diag
0 views • 30 slides

Software Process Modeling State Diagrams Lab Exercises
Dive into the world of state diagrams and state machine diagrams in software process modeling. Explore hands-on exercises such as creating state diagrams for controlling air conditioners and garage doors. Understand the importance of capturing object states in OOP and learn how to represent transiti
0 views • 7 slides
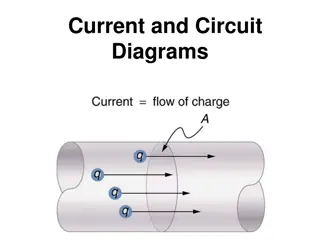
Understanding Current and Circuit Diagrams
Current is the flow of electrical charge, measured in amperes. It flows from positively charged to negatively charged sources, while electrons flow in the opposite direction. Conductors allow charge to flow easily, while insulators do not. Circuit diagrams show how a circuit works, with a battery as
0 views • 16 slides
AeroMACS Network Overview and Infrastructure Diagrams
Detailed diagrams showcasing the AeroMACS network infrastructure and components from various perspectives, including airport network connectivity, aircraft perspective, overall network overview, traffic flow management, and more. The diagrams illustrate the interconnection of different elements such
0 views • 6 slides

Understanding Fluid Flow and Measurement Devices
The concept of rotational and irrotational flow adjacent to a straight boundary, along with the dynamics of fluid flows and laws governing fluid flow like the continuity equation and energy equation, are discussed. Insights into devices for flow measurement such as venturimeter, pitot tube, orifices
0 views • 4 slides