Asia-Pacific Molecular Diagnostics Market
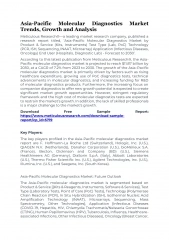
Asia-Pacific Molecular Diagnostics Market\nAsia-Pacific Molecular Diagnostics Market by Product & Service (Kits, Instruments) Test Type (Lab, PoC) Technology (PCR, ISH, Sequencing, INAAT, Microarray) Application (Infectious Diseases, Oncology) End User (Hospitals, Diagnostic Lab)
0 views • 3 slides
Understanding Data Visualization with Matplotlib in Python
Matplotlib is a powerful Python package for data visualization, offering both an integrated interface (pyplot) and a native object-oriented interface. This tool enables users to create various types of plots and gives control over the visualization process. Learn about basic operations, differences
6 views • 19 slides
Understanding Molecular Dynamics: Insights from Across Scales
Exploring molecular dynamics from molecules to pandemics, this presentation delves into the intricate energy landscapes of molecular systems, sampling problems, advanced techniques, and analysis of simulations to uncover valuable insights crucial for various scientific disciplines like drug discover
5 views • 21 slides
Understanding Molecular Docking in Bioinformatics
Explore the world of molecular docking in bioinformatics through in silico approaches, learning about protein-ligand interactions, modes of docking, different docking approaches, and the theory of enzymes. Discover how this computational method helps predict the binding affinity and conformation of
4 views • 41 slides
Evolutionary Models in Molecular Biology
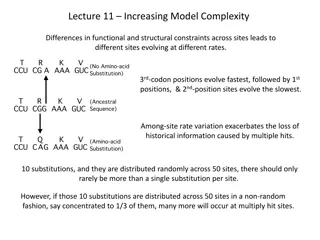
Differences in functional and structural constraints across sites lead to varying rates of evolution in molecular sequences. Understanding the complexities of site-specific rates, among-site rate variation, site-specific rates models, invariable sites model, and continuous methods is crucial for acc
6 views • 15 slides
Open Source Chat Based Data Visualization With Helical Insight
Open Source Chat Based Data Visualization plays a pivotal role in modern business operations, enabling organizations to derive insights, make informed decisions, and drive growth. However, traditional visualization tools often come with high costs and steep learning curves, limiting accessibility an
1 views • 2 slides
Unsaturated Hydrocarbons Alkynes
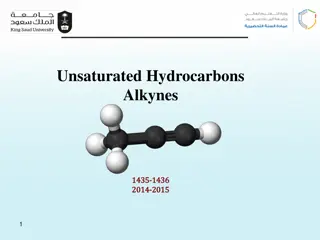
Chapter three delves into the world of alkynes, focusing on their structure, hybridization, bonding, nomenclature, physical properties, preparation, and reactions. Alkynes are hydrocarbons with at least one triple bond, forming a homologous series with the molecular formula CnH2n-2. The sp hybridiza
0 views • 20 slides
Benefits of Open Source Chat-based Data Visualization
In the realm of Business Intelligence (BI), data visualization plays a pivotal role in transforming raw data into actionable insights. Traditional BI tools often require users to possess technical expertise in querying databases and creating visualizations. However, the emergence of open source chat
1 views • 2 slides
Open Source Alternative to Tableau for Data Visualization in 2024
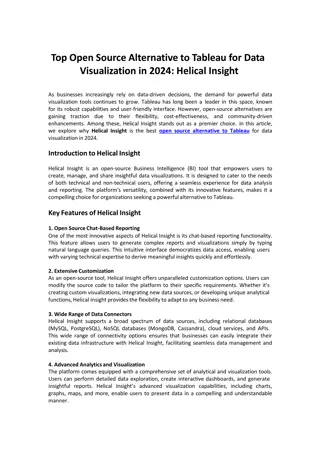
As businesses increasingly rely on data-driven decisions, the demand for powerful data visualization tools continues to grow. Tableau has long been a leader in this space, known for its robust capabilities and user-friendly interface. However, open-source alternatives are gaining traction due to the
0 views • 2 slides
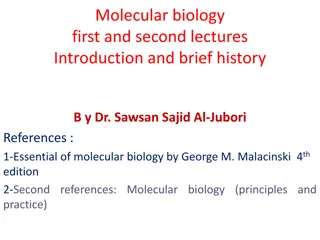
History of Molecular Biology: Key Experiments and Discoveries
This content covers the introduction and brief history of molecular biology, highlighting key experiments such as the work of Freidrich Miescher, Griffith's transformation experiment, and Avery-MacLeod-McCarty's proof of DNA as the genetic material. It explores the early understanding of macromolecu
0 views • 17 slides
Genetics and Molecular Biology Lecture Series by Dr. Madan K. Bhattacharyya
Explore a comprehensive lecture series covering Genetics, Molecular Genetics, and Recent Advances in Plant Breeding by expert Dr. Madan K. Bhattacharyya. Delve into topics such as gene structure, transcription, translation, and the central dogma of molecular biology through informative visuals and v
2 views • 46 slides
Exploring Supramolecular Chemistry: Insights and Applications
Supramolecular chemistry delves into the chemistry of molecular assemblies, intermolecular bonds, and non-covalent interactions, leading to the formation of supra-molecules through aggregation of molecular subunits. Concepts like molecular recognition, self-organization, and host-guest chemistry pla
0 views • 18 slides
Understanding Infrared Spectroscopy and Molecular Vibrations
Exploring the fascinating world of infrared spectroscopy and molecular vibrations. Learn about the different regions of the infrared spectrum, Hooke's law, vibrational frequencies, and the types of molecular vibrations. Discover how bond strength, reduced mass, and wave numbers are interconnected in
0 views • 18 slides
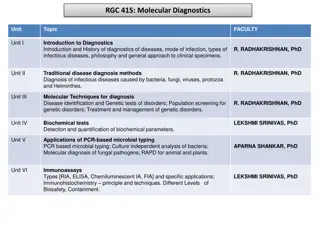
Comprehensive Overview of Molecular Diagnostics, Cytogenetics, and Forensic Biology
Explore a detailed curriculum covering molecular diagnostics, traditional disease diagnosis methods, genetic disorders, cytogenetics, molecular techniques, biochemical tests, PCR applications, immunoassays, and forensic biology including microbial forensics, entomology, botany, serology. Lectures co
1 views • 4 slides
Reusing Phylogenetic Data for Enhanced Visualization and Analysis
Reusing phylogenetic data can revolutionize scientific research by enabling synthesis of knowledge and comparative analyses across scientific disciplines. However, a significant portion of valuable phylogenetic data is lost due to the prevalent use of static images for tree publication. To address t
0 views • 8 slides
Understanding Wind Tunnels: Devices for Aerodynamic Testing
Wind tunnels are devices that simulate air flows to test models under controlled conditions. They are classified as low-speed and high-speed tunnels, used to replicate flying or moving objects. Testing involves studying air motion using techniques like smoke visualization, colored threads, and speci
2 views • 37 slides
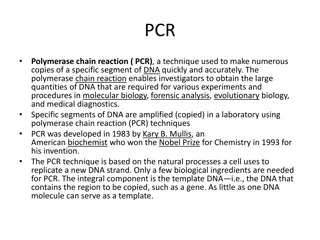
PCR and Blot Techniques in Molecular Biology
Polymerase Chain Reaction (PCR) is a crucial technique for amplifying specific DNA segments rapidly and accurately. Developed in 1983, PCR is widely used in various fields such as molecular biology, forensics, evolution, and medical diagnostics. On the other hand, the Blot technique transfers DNA, R
0 views • 10 slides
Understanding Gene Mutations in Molecular Biology
Gene mutations play a significant role in molecular biology, leading to alterations in DNA sequences that can impact offspring. These mutations can arise spontaneously or be induced by various factors, such as mutagens. Understanding gene mutations is crucial for comprehending the genetic basis of c
2 views • 27 slides
Interactive Plotting with ggplot and Shiny: Enhancing Galaxy Visualization Tools
Explore the concept of transforming existing ggplot2 Galaxy tools into interactive platforms using Shiny or Plotly implementations. Discover a variety of plot types available with ggplot2, such as barplots, violin plots, PCA plots, and heatmaps. Utilize additional plot options through various geom_*
1 views • 9 slides
Understand Molecular Structures with Lewis Dot Symbols
Explore the world of molecular structures with Lewis dot symbols in this chemistry unit. Learn about valence electrons, covalent bonding, and the HONC 1234 rule through engaging activities and discussions. Create accurate structural formulas and describe bonding in molecular substances. Get ready to
0 views • 13 slides
Molecular Docking for Drug Design and Analysis using MOE
Molecular docking with protein-ligand using the MOE software is a crucial step in drug discovery, allowing for the generation of stable adduct structures through interaction analysis. MOE offers various applications like structure-based design, and it integrates visualization, modeling, and simulati
0 views • 10 slides
Breast Cancer Survival Disparities by Molecular Subtypes in the US
Breast cancer molecular subtypes play a crucial role in determining survival outcomes. This study by Nadia Howlader, PhD, from the National Cancer Institute, presented the first nationally representative estimates of breast cancer survival by four main molecular subtypes. The research aimed to under
1 views • 23 slides
EEG Conformer: Convolutional Transformer for EEG Decoding and Visualization
This study introduces the EEG Conformer, a Convolutional Transformer model designed for EEG decoding and visualization. The research presents a cutting-edge approach in neural systems and rehabilitation engineering, offering advancements in EEG analysis techniques. By combining convolutional neural
1 views • 6 slides
Design and Evaluation in Visualization Techniques
Understanding the importance of formal evaluations in visualization techniques, this material covers a range of evaluation methods including empirical and analytic approaches such as usability tests, controlled experiments, and expert reviews. It delves into the scientific method of hypothesis forma
1 views • 41 slides
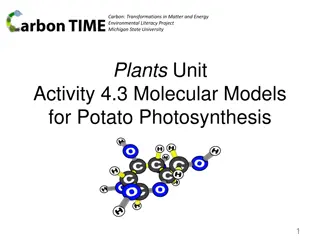
Understanding Potato Photosynthesis: Molecular Models and Chemical Changes
Explore the process of photosynthesis in potato plants through molecular models and chemical changes at different scales, from atomic-molecular to macroscopic. Learn how potato plants produce food through biosynthesis and cellular respiration, connecting the atomic-molecular scale to the macroscopic
0 views • 23 slides
Understanding Molecular Vibrations in Vibrational Spectroscopy
Explore the world of molecular vibrations and their significance in vibrational spectroscopy. Learn about the different types of vibrations in diatomic and triatomic molecules, the concept of degrees of freedom, and how atoms change positions to create varying bond lengths and angles. Discover the r
0 views • 47 slides
Multidimensional Icons in Data Visualization Solutions
This collection showcases various types of visual icons used in data visualization to represent values of different variables, such as categorical, quantitative, and Boolean data. Each icon summarizes specific information for a given item in a collection, ranging from nominal and ordinal data to the
0 views • 9 slides
Enhancing Safety in Navigation Through Improved Data Quality Visualization
The IHO Data Quality Working Group focuses on classifying and depicting the quality of digital hydrographic information to ensure safe navigation. The group addresses the need for clear warnings on ECDIS displays regarding poor-quality survey data. Despite progress in developing visualization method
0 views • 34 slides
Exploring Molecular Biology and Cell Science
Molecular biology delves into the study of biology at the molecular level, focusing on gene structure and functions to comprehend hereditary traits, genetic variation, and gene expression patterns. Cells, the fundamental units of life, vary in shape and function but share basic structures. The Three
0 views • 31 slides
Software Design Patterns for Information Visualization
Explore design patterns for information visualization interfaces, understand the complexities, and leverage tools like Google API. Learn about different software design patterns, categories of patterns for information visualization, and the relationships between them. Discover the reference model fo
0 views • 27 slides
Understanding the Influence of Molecular Weight on Polymer Flow Behavior
Molecular weight plays a critical role in determining the flow behavior of polymers above their glass transition temperature or melting point. The zero shear viscosity of polymers is directly related to their molecular weight, with significant changes in viscosity observed even with small difference
0 views • 13 slides
Interactive Data Visualization Tools and Techniques Quiz
This quiz tests knowledge on data visualization tools, techniques, and concepts. Questions cover topics such as the use of EDA in data visualization, interactive graph outputs, historical figures in data visualization, GIS data types in SAS/JMP, outlier detection in 3D scatterplots, and limitations
0 views • 11 slides
Cognition Models in InfoVis: Understanding Knowledge Creation Process
Visualization plays a key role in aiding cognition by supporting knowledge creation and seeking tasks through process models and task taxonomies. Understanding the cognitive aspects of information visualization is crucial for aiding comprehension and knowledge understanding, as demonstrated by the u
0 views • 41 slides
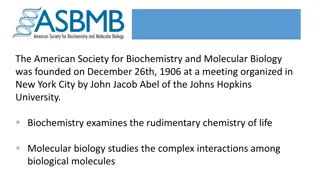
The American Society for Biochemistry and Molecular Biology - Advancing Research in Life Sciences
Founded in 1906, the American Society for Biochemistry and Molecular Biology (ASBMB) is a prominent organization that explores the fundamental chemistry of life and intricate interactions among biological molecules. ASBMB publishes prestigious research journals covering various fields such as microb
0 views • 5 slides
Enhancing Classmate's Data Visualization for Homework Assignment 2
Explore the process of applying a classmate's data visualization code to your own data for Homework Assignment 2. Critique the effectiveness of the visualization in conveying the intended point and offer suggestions for improvement if necessary. Follow the steps outlined to submit your completed ass
0 views • 4 slides
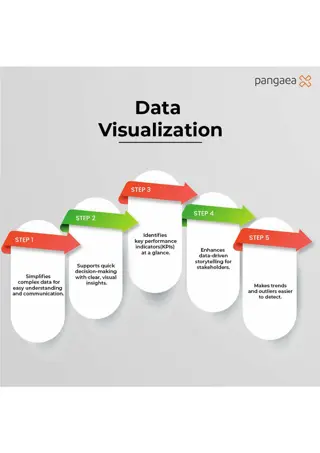
Maximize Business Impact with Data Visualization
This infographic shows how data visualization simplifies complex data, supports decision-making, highlights KPIs, and enhances data-driven storytelling. Its an essential tool for identifying trends and outliers. Discover expert data visualization talent at Pangaea X by visiting www.pangaeax.com.
6 views • 1 slides
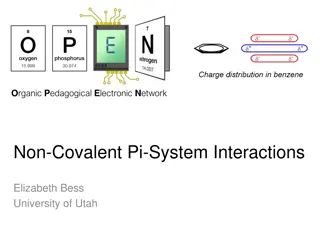
Understanding Non-Covalent Pi-System Interactions in Molecular Structures
Non-covalent interactions play a crucial role in chemical selectivity and molecular recognition. This article discusses the significance of Pi-system interactions, including Pi-Pi and Cation-Pi interactions, in stabilizing molecular structures like DNA helices and G-quadruplexes. Insights into molec
0 views • 6 slides
Polymer Molecular Weight Exercise Analysis
This exercise involves calculating the number average and weight average molecular weights, as well as the polydispersity index (PDI) for a sample of polystyrene composed of fractions with different molecular weights. The analysis includes determining the number of moles in each fraction, calculatin
0 views • 7 slides
Data Visualization Presentations Collection
Collection of various image slides containing charts, graphs, and data visualization elements. The slides showcase different types of visual representations such as bar graphs, line charts, percentages, and more. Each slide provides a unique visualization, making it a diverse collection for presenta
0 views • 13 slides
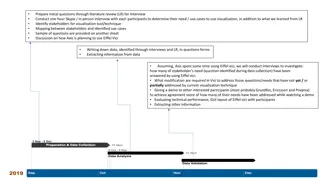
Effective Stakeholder Interviews for Visualization Tool Improvement
Conducting in-depth interviews with stakeholders is crucial for identifying their needs and use cases for visualization tools. By asking targeted questions and analyzing responses, insights can be gained to enhance the current visualization technique, like Eiffel Vici. The process involves mapping s
0 views • 5 slides
