Ambitious Math Teaching and Expectations for Students as Learners
Reflect on expectations for students as math learners and explore ambitious math teaching practices. Join the Oregon Math Project to promote equitable math experiences for all students.
0 views • 106 slides

Principles and Practices of Ambitious Math Teaching Oregon Math Project
Explore the ambitious math teaching principles and practices outlined in the Oregon Math Project, focusing on sustaining ambitious math teaching through effective planning, teaching, and assessment strategies. Discover how to value and build on students' mathematical strengths to promote equitable o
0 views • 120 slides

Ambitious Math Teaching at Unit Level - Session 10 Agenda
In Session 10 of the Oregon Math Project, educators focus on engaging students in rich grade-level content through ambitious math teaching. The agenda includes setting norms, collaborative math activities, connecting to research, and planning classroom implementation. Emphasis is placed on supportin
0 views • 89 slides

Engaging Esti-Mystery Activities for Rich Math Discourse
Enhance your math classroom with Esti-Mysteries using embedded charts for interactive learning. Choose the right version based on how your students engage with charts and writing. Encourage estimation, critical thinking, and collaborative discussions. Follow step-by-step animated clues to narrow dow
4 views • 19 slides

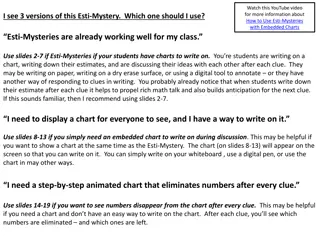
Exciting Ways to Use Esti-Mysteries with Embedded Charts
Explore three versions of Esti-Mysteries to engage students in writing estimates, discussing ideas, and using charts dynamically. Choose the version that best suits your classroom needs and enhance math discussions and anticipation for the next clue. Utilize slides with charts for writing, embedded
8 views • 19 slides
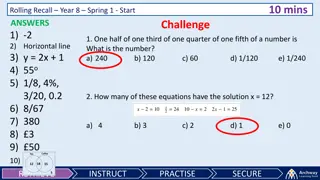
Year 8 Spring Math Challenge: Test Your Skills in 10 Minutes!
Test your math skills with these challenging questions from a Year 8 Spring math challenge. From solving equations to geometry problems, these interactive challenges will help you sharpen your math abilities in just 10 minutes at a time. Get ready to push your math knowledge to the limit and see how
0 views • 3 slides
Understanding the Challenges of Learning Math
Exploring the reasons why math can be perceived as tough, this study skills resource delves into the analogy of math being like a foreign language and a skill that requires practice. It compares high school and college approaches to math education and dispels common myths, emphasizing that everyone
1 views • 12 slides

Pie Chart Construction and Interpretation Tips
Learn how to draw pie charts, understand important data vocabulary, and analyze pie chart results with practical examples. Explore ways to present and measure data effectively using pie charts. Discover online resources for drawing pie charts even without a compass or protractor. Gain insights into
1 views • 10 slides
Engaging Math Activity with Esti-Mysteries: Interactive Charts and Clues
Dive into an engaging math activity utilizing Esti-Mysteries, where students work on narrowing down possibilities based on clues to determine the number of erasers in a vase. Choose from different sets of slides depending on your classroom setup, from traditional writing methods to interactive digit
0 views • 19 slides

Interactive Esti-Mystery Charts for Engaging Math Learning
Explore three versions of Esti-Mystery charts to enhance math learning in your classroom. From writing on charts to animated step-by-step elimination, these tools support rich math discussions and student engagement. Choose the version that suits your teaching style and watch your students dive into
0 views • 19 slides
Interactive Esti-Mysteries with Embedded Charts for Engaging Math Activities
Explore the three versions of Esti-Mysteries and discover which one suits your classroom best. Enhance math discussions by using embedded charts where students write down their estimates and engage in collaborative problem-solving. Choose from different slide sets based on your classroom setup and t
0 views • 19 slides

National 5 Applications of Maths: Charts, Graphs, and Tables Examples
Explore various examples related to reading bar charts, line graphs, stem-and-leaf diagrams, pie charts, and constructing stem-and-leaf charts in the context of National 5 Applications of Maths. Practice interpreting data from tables, line graphs, and stem-and-leaf diagrams to enhance your understan
0 views • 18 slides

Mastering Financial Presentation with Charts
Learn how to effectively present financial results and analysis like a pro using various types of charts such as waterfall charts, stacked bar charts, and mekko charts. Understand how to interpret income statements, identify areas for improvement, compare trends over time, and showcase budget growth
1 views • 21 slides

Interactive Esti-Mystery Charts for Engaging Math Discussions
Explore three versions of Esti-Mystery charts to engage students in rich math discussions. Choose the slides based on your class's needs: for writing on charts, embedded charts for discussion, or an animated chart that eliminates numbers. Follow the clues, make estimates, and narrow down possibiliti
0 views • 19 slides

Interactive Esti-Mystery Charts for Engaging Math Lessons
Explore different versions of Esti-Mystery charts to engage students in rich math discussions. Choose from slides for writing on charts, embedded charts for discussion, or animated charts that eliminate numbers. Follow clues to estimate the number of beads in a glass and narrow down possibilities. E
0 views • 19 slides

Understanding the Importance of Flow Charts in System Processes
Flow charts are valuable tools that visually represent the flow of data and process steps within a system. They help define problems, sequence steps to solve them, and show alternatives if issues arise. By using standard symbols, flow charts facilitate communication between engineers and clients, ai
1 views • 35 slides

Understanding Weighted Moving Average Charts for Process Monitoring
Weighted moving average charts are powerful tools for detecting small shifts and trends in process means. By utilizing Uniformly Weighted Moving Average (UWMA) charts and Exponentially Weighted Moving Average (EWMA) charts, organizations can monitor and identify changes in process means with precisi
1 views • 29 slides

Overview of Attribute Control Charts in Quality Management
Attribute control charts are used in quality management to monitor the conformity of products or services based on specific characteristics. Unlike variable charts, attribute charts categorize items as conforming or non-conforming. This summary discusses the importance of attribute charts, focusing
0 views • 71 slides

Interactive Esti-Mystery Math Activity for Students
Engage your students in a fun and educational Esti-Mystery activity where they write down estimates on a chart, discuss their ideas, and narrow down possibilities based on clues. Choose from different versions based on your classroom setup and needs. Use animated charts or embedded charts for a dyna
0 views • 19 slides

Complete Guide to Radar Charts: Benefits, Drawbacks, and Tips
Radar charts, also known as spider charts, offer a graphical way to compare data in a web-like form, making it easy to evaluate multiple alternatives based on various criteria. While radar charts have benefits like highlighting strengths and deficiencies clearly, they also come with drawbacks such a
0 views • 12 slides
Understanding Charts for Data Visualization in Excel 2016
Charts in Excel 2016 are powerful tools for visually representing quantitative data, helping to convey patterns, trends, and comparisons effectively. This guide covers the purpose of charts, avoiding chart junk, different types of charts like Column, Bar, Line, and more, and their specific uses in d
0 views • 17 slides

Data Presentation Techniques for Effective Communication
Explore various data presentation methods including charts, tables, and graphs to effectively communicate data insights. Learn about different types of charts, their uses, and guidelines for creating impactful visual representations. Dive into examples of bar charts, pareto charts, and pie charts to
1 views • 34 slides
Enhancing Math Pathways for College Completion
Addressing the significance of mathematics in degree completion, the Complete College Georgia initiative focuses on aligning gateway math courses with academic programs. Recommendations include offering Quantitative Reasoning and Introduction to Mathematical Modeling for non-STEM majors. The Algebra
0 views • 20 slides
Balanced Math Program Overview
This presentation introduces the Balanced Math Program brought to you by Math Coaches Lisa Shogren and Jenn Vomocil. The session covers the goals of the program, including understanding the five steps involved: Math Review, Mental Math, Problem Solving, Conceptual Understanding, Mastery of Math Fact
0 views • 30 slides

Interactive Esti-Mystery Charts for Engaging Math Discussions
Dive into the world of Esti-Mystery charts to enhance math discussions in your classroom. Choose the right version based on your needs, whether it's writing on a chart, using embedded charts, or animated charts. Follow the clues, make estimations, and encourage strong mathematical reasoning. Empower
0 views • 19 slides
Understanding Infant Growth Charts in MTN-016 for Effective Monitoring
Infant growth charts are essential tools used to monitor a child's growth trajectory over time. MTN-016 utilizes WHO growth standards for infants up to one year. Learn how to accurately use growth charts, adjust for gestational age, interpret percentile curves, and describe plotted points. These cha
0 views • 27 slides
Understanding Java Math Methods
Explore Java Math methods that return values, such as Math.abs, Math.pow, Math.sqrt, Math.round, Math.min, and more. Learn about the importance of return values, the quirks of real numbers, type casting, and how to efficiently utilize these methods in your Java programming projects.
0 views • 12 slides

Engaging Math Activity: Esti-Mystery Whistle Challenge
Explore the Esti-Mystery Whistle Challenge where students make estimates, write them down, and discuss their ideas based on clues provided. Choose the version that suits your class best - with slides for writing on charts, embedded charts for discussion, or animated charts for number elimination. Na
0 views • 19 slides

Interactive Esti-Mystery Charts for Rich Math Talk
Explore different versions of Esti-Mysteries to enhance math discussions in your class. Choose the version that best suits your needs, whether it's writing on charts, using embedded charts, or animated charts that eliminate numbers after each clue. Engage students in estimating bead counts and narro
0 views • 19 slides
Understanding Exponentially Weighted Moving Average Control Charts
Exponentially Weighted Moving Average (EWMA) control charts offer an effective alternative to Shewhart control charts for detecting small shifts in processes. This article explores the definition, properties, and calculations involved in EWMA control charts, providing insights on using this method i
0 views • 28 slides
Comprehensive Guide to Emergent Math Apps for iPad
Explore a comprehensive list of emergent math skills apps for iPad curated to enhance the development of math skills in students. Discover a range of apps covering numbers, counting, patterns, geometry, money, time, and more essential areas of mathematics education. Learn what to look for in math ap
1 views • 18 slides

Interactive Esti-Mystery Chart Activity
Explore different versions of Esti-Mystery charts and choose the one that best suits your classroom needs. From writing on physical charts to using animated elimination charts, this activity encourages estimation, critical thinking, and collaborative discussions among students. Follow the clues, nar
0 views • 19 slides
Understanding Run Charts in Quality Improvement Projects
Run charts are essential tools in quality improvement projects, allowing the tracking of data points over time to identify signals of improvement or degradation. They are used in the MAP-IT QI process to assess historical metrics before planning improvements. This brief provides insights on when to
0 views • 12 slides

Engaging Esti-Mystery Math Activity: Interactive Charts and Clues
Dive into the world of Esti-Mystery with this engaging math activity using interactive charts and clues. Choose the version that best suits your classroom - whether it's writing on charts, discussing ideas, or using animated charts. Follow the clues, eliminate numbers, and make estimations to uncove
0 views • 19 slides
Deep Learning for Math Knowledge Processing: Goals and Related Work
This project aims to leverage deep learning for math-entity representation learning, math semantics extraction, and application development in the fields of mathematics and natural language processing. The long-term objectives include semantic enrichment of math expressions, conversion of math to co
2 views • 29 slides
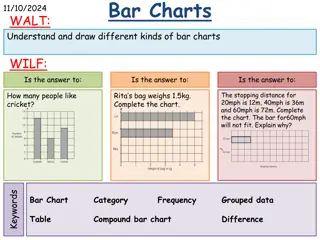
Understanding Different Types of Bar Charts with Examples
Explore the world of bar charts through various examples such as favorite subjects, animals, and sports, along with practical exercises. Learn to interpret and draw different types of bar charts like compound, comparative, and composite charts. Discover how to represent data visually and analyze key
0 views • 9 slides
Understanding Control Charts: Tools for Process Monitoring
Control charts are essential tools in statistical process control systems. They help distinguish between natural and assignable variations in a process. By monitoring sample statistics and setting control limits, organizations can detect issues and take corrective actions promptly. This comprehensiv
1 views • 24 slides

Interactive Esti-Mystery Charts for Classroom Engagement
Explore three versions of the Esti-Mystery activity to engage students in chart estimation and math discussions. Choose from options with writable charts, embedded charts, or animated charts to enhance the interactive learning experience. Follow clues, narrow down possibilities, make estimations, an
0 views • 19 slides

Interactive Esti-Mystery Charts for Engaging Math Discussions
Explore the three versions of Esti-Mystery charts for an engaging math experience in your classroom. Choose between slides for students to write estimates on charts, use an embedded chart for discussions, or enjoy an animated chart that eliminates numbers after each clue. Encourage rich math talk an
0 views • 19 slides

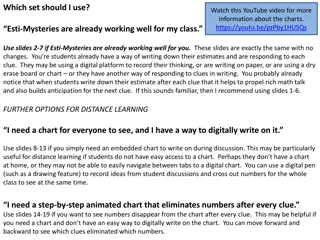
Interactive Esti-Mystery Charts for Engaging Math Learning
Explore different sets of charts for engaging math learning experiences, from traditional Esti-Mystery slides to interactive digital options for distance learning. Discover step-by-step animated charts that enhance student engagement and critical thinking skills. Utilize various clues to estimate an
0 views • 19 slides