
Exploring Product and Knowledge Graphs for Enhanced Information Retrieval
Dive into the world of product and knowledge graphs, uncovering the journey to a rich product graph, examples of knowledge graphs for songs, and the mission to provide comprehensive information on products and related knowledge. Discover use cases ranging from information provision to enhancing sear
3 views • 76 slides

Exciting Ways to Use Esti-Mysteries with Embedded Charts
Explore three versions of Esti-Mysteries to engage students in writing estimates, discussing ideas, and using charts dynamically. Choose the version that best suits your classroom needs and enhance math discussions and anticipation for the next clue. Utilize slides with charts for writing, embedded
8 views • 19 slides

Pie Chart Construction and Interpretation Tips
Learn how to draw pie charts, understand important data vocabulary, and analyze pie chart results with practical examples. Explore ways to present and measure data effectively using pie charts. Discover online resources for drawing pie charts even without a compass or protractor. Gain insights into
1 views • 10 slides

Exploring Various Types of Graphs in Statistics Education
Delve into the world of data visualization with slow reveal graphs, column graphs, pictographs, dot plots, divided bar graphs, sector graphs, line graphs, and stem-and-leaf plots. Engage in observations and wonderings to enhance statistical comprehension and analytical skills.
1 views • 8 slides

National 5 Applications of Maths: Charts, Graphs, and Tables Examples
Explore various examples related to reading bar charts, line graphs, stem-and-leaf diagrams, pie charts, and constructing stem-and-leaf charts in the context of National 5 Applications of Maths. Practice interpreting data from tables, line graphs, and stem-and-leaf diagrams to enhance your understan
0 views • 18 slides

Analyzing Questionnaire Data for School Sustainability Enhancement
Explore ways to analyze questionnaire data to assess school sustainability and make informed decisions for improvement. Learn about different types of graphs, constructing tally tables, creating bar charts, line graphs, and pie charts to visually represent data effectively. Develop critical thinking
0 views • 17 slides

Exploring Graphs: An Introduction to Data Visualization
This chapter delves into various types of graphs used in data representation, such as bar graphs, pie graphs, histograms, line graphs, and linear graphs. It explains the purpose and structure of each graph type, along with practical examples. Additionally, it covers the Cartesian system for locating
0 views • 15 slides

Mastering Financial Presentation with Charts
Learn how to effectively present financial results and analysis like a pro using various types of charts such as waterfall charts, stacked bar charts, and mekko charts. Understand how to interpret income statements, identify areas for improvement, compare trends over time, and showcase budget growth
1 views • 21 slides

Interactive Esti-Mystery Charts for Engaging Math Discussions
Explore three versions of Esti-Mystery charts to engage students in rich math discussions. Choose the slides based on your class's needs: for writing on charts, embedded charts for discussion, or an animated chart that eliminates numbers. Follow the clues, make estimates, and narrow down possibiliti
0 views • 19 slides

Interactive Esti-Mystery Charts for Engaging Math Lessons
Explore different versions of Esti-Mystery charts to engage students in rich math discussions. Choose from slides for writing on charts, embedded charts for discussion, or animated charts that eliminate numbers. Follow clues to estimate the number of beads in a glass and narrow down possibilities. E
0 views • 19 slides

Understanding the Importance of Flow Charts in System Processes
Flow charts are valuable tools that visually represent the flow of data and process steps within a system. They help define problems, sequence steps to solve them, and show alternatives if issues arise. By using standard symbols, flow charts facilitate communication between engineers and clients, ai
1 views • 35 slides

Understanding Weighted Moving Average Charts for Process Monitoring
Weighted moving average charts are powerful tools for detecting small shifts and trends in process means. By utilizing Uniformly Weighted Moving Average (UWMA) charts and Exponentially Weighted Moving Average (EWMA) charts, organizations can monitor and identify changes in process means with precisi
1 views • 29 slides

Insightful Charts and Graphs on Bangladesh - Asia Profiles
Discover a collection of informative charts and graphs providing valuable insights into Bangladesh's data and statistics. Explore key information visually presented in slides showcasing various aspects of the country's profile.
0 views • 15 slides

Overview of Attribute Control Charts in Quality Management
Attribute control charts are used in quality management to monitor the conformity of products or services based on specific characteristics. Unlike variable charts, attribute charts categorize items as conforming or non-conforming. This summary discusses the importance of attribute charts, focusing
0 views • 71 slides

Complete Guide to Radar Charts: Benefits, Drawbacks, and Tips
Radar charts, also known as spider charts, offer a graphical way to compare data in a web-like form, making it easy to evaluate multiple alternatives based on various criteria. While radar charts have benefits like highlighting strengths and deficiencies clearly, they also come with drawbacks such a
0 views • 12 slides

Geographical Skills: Aerial Photographs, Charts, Graphs and Infographics
Aerial photographs are key tools for interpreting land surfaces, with vertical and oblique types used for different perspectives. Locating places on photographs involves dividing them into sections and understanding directions. Sketching aerial photographs requires creating a frame and dividing sect
0 views • 30 slides

Representation of Abstract Groups through Graphs
Explore the representation of abstract groups as automorphism groups of graphs, touching on topics such as the existence of graphs whose automorphism groups are isomorphic to given abstract groups, the cardinality of connected graphs satisfying specific properties, and questions regarding the cardin
0 views • 16 slides
Understanding Charts for Data Visualization in Excel 2016
Charts in Excel 2016 are powerful tools for visually representing quantitative data, helping to convey patterns, trends, and comparisons effectively. This guide covers the purpose of charts, avoiding chart junk, different types of charts like Column, Bar, Line, and more, and their specific uses in d
0 views • 17 slides
Understanding Low Threshold Rank Graphs and Their Structural Properties
Explore the intriguing world of low threshold rank graphs and their structural properties, including spectral graph theory, Cheeger's inequality, and generalizations to higher eigenvalues. Learn about the concept of threshold rank, partitioning of graphs, diameter limits, and eigenvectors approximat
0 views • 22 slides

Exploring Types of Graphs for Data Representation
Different types of graphs, such as line graphs, scatter plots, histograms, box plots, bar graphs, and pie charts, offer diverse ways to represent data effectively. Understanding when to use each type based on the data being collected is essential for insightful analysis. Scatter plots are ideal for
2 views • 37 slides

Data Presentation Techniques for Effective Communication
Explore various data presentation methods including charts, tables, and graphs to effectively communicate data insights. Learn about different types of charts, their uses, and guidelines for creating impactful visual representations. Dive into examples of bar charts, pareto charts, and pie charts to
1 views • 34 slides

Exploring Relationships Through Graphs
Learn how to analyze and relate two quantities using graphs, analyze data presented in tables and graphs, and sketch graphs representing various scenarios such as the movement of a model rocket or a playground swing. The visuals provided will help you understand how to interpret and draw graphs in d
2 views • 7 slides

Enhancing Understanding of Graphs and Charts for English Class X Students
Explore the world of graphs and charts in English class X with detailed lessons on identifying chart types, describing charts both orally and in writing. Get familiar with key words and phrases to interpret data fluctuations and learn through practical examples depicting changes in workload and stud
0 views • 10 slides
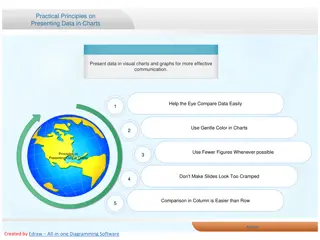
Best Practices for Effective Data Presentation in Charts
Present data effectively using visual charts and graphs by following principles such as using gentle colors, using fewer figures, avoiding cramped slides, and utilizing bar and plot charts for easy data comparison. Make sure to consider color choices, digit simplification, slide spacing, and data cl
0 views • 7 slides

Interactive Esti-Mystery Charts for Engaging Math Discussions
Dive into the world of Esti-Mystery charts to enhance math discussions in your classroom. Choose the right version based on your needs, whether it's writing on a chart, using embedded charts, or animated charts. Follow the clues, make estimations, and encourage strong mathematical reasoning. Empower
0 views • 19 slides
Understanding Infant Growth Charts in MTN-016 for Effective Monitoring
Infant growth charts are essential tools used to monitor a child's growth trajectory over time. MTN-016 utilizes WHO growth standards for infants up to one year. Learn how to accurately use growth charts, adjust for gestational age, interpret percentile curves, and describe plotted points. These cha
0 views • 27 slides
Understanding Data and Graphs: Variables Analysis
Practice interpreting data and graphs related to variables such as independent and dependent variables. Analyze circle, line, and bar graphs, data tables, and charts to understand concepts like time allocation, car trip details, demand and price relationship, atomic element properties, mass-force co
0 views • 17 slides

Interactive Esti-Mystery Charts for Rich Math Talk
Explore different versions of Esti-Mysteries to enhance math discussions in your class. Choose the version that best suits your needs, whether it's writing on charts, using embedded charts, or animated charts that eliminate numbers after each clue. Engage students in estimating bead counts and narro
0 views • 19 slides

Uniquely Bipancyclic Graphs by Zach Walsh
Research conducted at the University of West Georgia focused on uniquely bipancyclic graphs, defined as bipartite graphs with exactly one cycle of specific lengths determined by the order. Uniquely bipancyclic graphs have special properties, including having a Hamiltonian cycle and a specific order
0 views • 18 slides
Understanding Exponentially Weighted Moving Average Control Charts
Exponentially Weighted Moving Average (EWMA) control charts offer an effective alternative to Shewhart control charts for detecting small shifts in processes. This article explores the definition, properties, and calculations involved in EWMA control charts, providing insights on using this method i
0 views • 28 slides

Understanding Graphs for Mathematical Interpretation
Explore how students can grasp information through graphical formats and convert it into mathematical graphs. Learn about qualitative graphs, functions, axes, and more. Delve into exercises matching graphs with situations and drawing graphs for given scenarios like plane take-off, biking, and snowbo
0 views • 16 slides
Understanding Categorical Data Displays and Analysis
Visual displays of categorical data such as bar graphs, pie charts, and frequency distributions help organize and interpret large amounts of data effectively. Different types of graphs serve specific purposes, like comparing categories visually and identifying modes easily. This overview covers the
0 views • 10 slides
Understanding Run Charts in Quality Improvement Projects
Run charts are essential tools in quality improvement projects, allowing the tracking of data points over time to identify signals of improvement or degradation. They are used in the MAP-IT QI process to assess historical metrics before planning improvements. This brief provides insights on when to
0 views • 12 slides

Engaging Esti-Mystery Math Activity: Interactive Charts and Clues
Dive into the world of Esti-Mystery with this engaging math activity using interactive charts and clues. Choose the version that best suits your classroom - whether it's writing on charts, discussing ideas, or using animated charts. Follow the clues, eliminate numbers, and make estimations to uncove
0 views • 19 slides
Understanding Graphs and Their Models
Explore the world of graphs through definitions, types, and special features. Learn about vertices, edges, simple and multiple graphs, directed and undirected graphs, and more. Discover the terminology and special types of graphs along with basic concepts and properties.
0 views • 33 slides
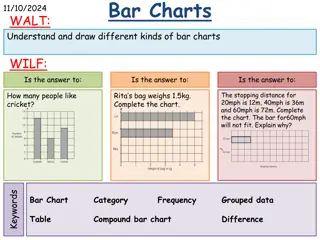
Understanding Different Types of Bar Charts with Examples
Explore the world of bar charts through various examples such as favorite subjects, animals, and sports, along with practical exercises. Learn to interpret and draw different types of bar charts like compound, comparative, and composite charts. Discover how to represent data visually and analyze key
0 views • 9 slides
Understanding Graphs in Mathematics and Computer Science
Graphs in mathematics and computer science are abstract data types used to represent relationships between objects. They consist of vertices connected by edges, which can be directed or undirected. Graphs find applications in various fields like electric circuits, networks, and transportation system
0 views • 19 slides
Understanding Control Charts: Tools for Process Monitoring
Control charts are essential tools in statistical process control systems. They help distinguish between natural and assignable variations in a process. By monitoring sample statistics and setting control limits, organizations can detect issues and take corrective actions promptly. This comprehensiv
1 views • 24 slides

Interactive Esti-Mystery Charts for Classroom Engagement
Explore three versions of the Esti-Mystery activity to engage students in chart estimation and math discussions. Choose from options with writable charts, embedded charts, or animated charts to enhance the interactive learning experience. Follow clues, narrow down possibilities, make estimations, an
0 views • 19 slides
Insights into Philippines Through Charts and Graphs
Explore a visual representation of data about the Philippines with charts and graphs. Gain valuable insights into various aspects of the country's demographics, economy, and more through these informative visuals.
0 views • 8 slides