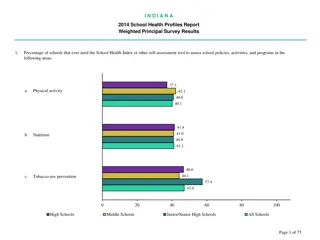
Teen Pregnancy Prevention Initiatives and Trends in Tennessee

Exploring data on teen pregnancies in Tennessee from 2005-2014, including rates per 1,000 females by age group and maternal race. The images depict trends and statistics, highlighting the importance of primary prevention initiatives in addressing teen pregnancy.
- Teen Pregnancy Prevention
- Tennessee Data Analysis
- Maternal Race Trends
- Primary Prevention Initiatives
- Youth Health

Uploaded on Sep 12, 2024 | 0 Views
Download Presentation

Please find below an Image/Link to download the presentation.
The content on the website is provided AS IS for your information and personal use only. It may not be sold, licensed, or shared on other websites without obtaining consent from the author. Download presentation by click this link. If you encounter any issues during the download, it is possible that the publisher has removed the file from their server.
E N D
Presentation Transcript
Primary Prevention Initiative: Teen Pregnancy Prevention Module Applying PPI to Teen Pregnancy
Teen Pregnancies by Age Group Tennessee, 2005-2014 120 111.4 109.2 107.6 106.5 102.3 100 88.7 86.8 Rate per 1,000 Females 81.1 80 73.1 69.3 60 34.7 40 34.3 33.7 33.6 29.6 24.8 22.4 21.2 18.2 16.1 20 1.5 1.3 1.2 1.2 0.9 0.8 0.7 0.7 0.7 0.6 0 2005 2006 2007 2008 2009 2010 2011 2012 2013 2014 10 to14 15 to 17 18 to19 Data sources: Tennessee Department of Health; Division of Policy, Planning and Assessment; Birth, Fetal Death and Induced Termination of Pregnancy Statistical Systems, 2008 Revision of the 2003 Population Estimates and Projections (2005-2009) and population estimates based on interpolated data from the U.S. Census s Annual Estimates of the Resident Population.
Births Among 15-19 Year Olds Tennessee and the United States, 2005-2014 60 54.8 53.8 53.7 53.0 49.5 50 43.1 40.8 Rate per 1,000 Females 38.4 40 34.7 41.5 41.1 40.2 33.0 39.7 37.9 34.3 30 31.3 29.4 26.5 24.2 20 Tennessee United States 10 0 2005 2006 2007 2008 2009 2010 2011 2012 2013 2014 Data sources: 1) Tennessee Department of Health; Division of Policy, Planning and Assessment; Birth Statistical System, 2008 Revision of the 2003 Population Estimates and Projections (2005-2009)and population estimates based on interpolated data from the U.S. Census s Annual Estimates of the Resident Population. 2) Martin, JA, Hamilton, BE, & Ventura, S J (2015). Births: Final Data for 2014. Hyattsville, MD: National Center for Health Statistics.
Data source: Martin, JA, Hamilton, BE, & Ventura, S J (2015). Births: Final Data for 2014. Hyattsville, MD: National Center for Health Statistics.
Data sources: 1) Tennessee Department of Health; Division of Policy, Planning and Assessment; Birth Statistical System and population estimates based on interpolated data from the U.S. Census s Annual Estimates of the Resident Population. 2) Martin, JA, Hamilton, BE, & Ventura, S J (2015). Births: Final Data for 2014. Hyattsville, MD: National Center for Health Statistics.
Births Among 15-19 Year Olds by Maternal Race Tennessee, 2005-2014 90 82.7 82.1 79.3 77.3 80 74.1 70 60.6 Rate per 1,000 Females 55.7 60 52.2 48.4 50 44.6 47.6 47.3 46.9 46.4 40 42.3 40.8 37.8 35.9 30 32.5 31.3 20 Black White 10 0 2005 2006 2007 2008 2009 2010 2011 2012 2013 2014 Data sources: Tennessee Department of Health; Division of Policy, Planning and Assessment; Birth Statistical System, 2008 Revision of the 2003 Population Estimates and Projections (2000-2009)and population estimates based on interpolated data from the U.S. Census s Annual Estimates of the Resident Population.
High School Students Who Have Ever Had Sex Tennessee, 2003-2013 100 90 80 70 60 54.7 54.4 53.4 52.4 Percent 50.1 47.5 50 40 30 20 10 0 2003 2005 2007 2009 2011 2013 Data Source: Centers for Disease Control and Prevention (CDC). 1991-2013 High School Youth Risk Behavior Survey Data. Available at http://nccd.cdc.gov/youthonline/. Accessed on 8/11/2014. Questions on teen sexual activity were not included in the 2015 YRBS 2013 is the most recent year for which these data are available.
High School Students Who Had Sex for the First Time Before Age 13 Tennessee, 2003-2013 20 18 16 14 12 Percent 10 8.9 8.5 7.5 7.5 7.4 7.2 8 6 4 2 0 2003 2005 2007 2009 2011 2013 Data Source: Centers for Disease Control and Prevention (CDC). 1991-2013 High School Youth Risk Behavior Survey Data. Available at http://nccd.cdc.gov/youthonline/. Accessed on 8/11/2014. Questions on teen sexual activity were not included in the 2015 YRBS 2013 is the most recent year for which these data are available.
Proven Primary Prevention Strategies Example 1 Preventing Early Initiation of Sexual Activity Objective: Increase youth access to evidence-based and evidence-informed programs to prevent teen pregnancy. Activity: Conduct teen pregnancy prevention programs, utilizing approved evidence-based curricula, at established community-based organizations Contact and partner with community-based programs Review and select quality evidence-based programs Provide an informational workshop for parents/caregivers on program contents Establish a method of transportation for youth to access scheduled programs
Proven Primary Prevention Strategies Example 2 Preventing Early Initiation of Sexual Activity Objective: Increase the percentage of youth who abstain from or delay sexual intercourse. Activity: Provide peer education/mentoring services for adolescents attending community-based programs Identify community-based organizations that are receptive to utilizing peer educators Establish a peer education team to promote the importance of appropriate sexual decision-making Provide comprehensive training for qualified and approved peer educators Provide informational workshops for parents/caregivers on the advantages of implementing a peer mentoring program
Proven Primary Prevention Strategies Example 3 Preventing Early Initiation of Sexual Activity Objective: Increase # of youth that participate in community service-learning projects Activity: Identify and partner with community organizations to involve youth in local service projects Identify service learning opportunities using community resources Encourage community organizations to involve youth in promoting and participating in acts of service Distribute print materials and display posters promoting the importance of community service for positive youth development Provide media coverage at local service events to emphasize youth participation and community collaborations
Proven Primary Prevention Strategies Scenes from a variety of community service learning projects that are connected to Adolescent Pregnancy Prevention and Abstinence Education Programs.
Proven Primary Prevention Strategies Teen Life Mazes provide an opportunity for teens to travel through a maze, and making potentially life altering decisions, and learning about what can happen to their life through the various decisions they make.
Additional Resources Healthy Teen Network http://www.healthyteennetwork.org/ CDC Teen Pregnancy Prevention 2010-2015 http://www.cdc.gov/TeenPregnancy/PreventTeenPreg.htm The National Campaign to Prevent Teen and Unplanned Pregnancy http://www.thenationalcampaign.org/ TN Department of Education Youth Risk Behavior Survey Results http://www.tn.gov/education/yrbs/index.shtml County Health Rankings http://www.countyhealthrankings.org/#app/tennessee/2012/measures/factors/14/map/
Technical Assistance Resources Kimothy Warren Teen Pregnancy Prevention and Abstinence Education Program Director 615-253-2657 Kelly Luskin Women s Health Nurse Consultant 615-741-0370


 Tennessee Department of Health; Division")