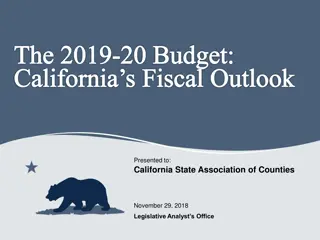
Outlook for 2020: Business Cycle Impact on Election Predictions

Professor Steven Kyle from Cornell University discusses the challenge of predicting turning points in the business cycle and its impact on election outcomes. With mixed outlooks on GDP growth, unemployment rates, inflation, and interest rates, the uncertainty of a potential economic slowdown looms over the forecast for the year ahead. The article highlights the difficulty in making accurate predictions but emphasizes the importance of monitoring key economic indicators for potential shifts.

Download Presentation

Please find below an Image/Link to download the presentation.
The content on the website is provided AS IS for your information and personal use only. It may not be sold, licensed, or shared on other websites without obtaining consent from the author. Download presentation by click this link. If you encounter any issues during the download, it is possible that the publisher has removed the file from their server.
E N D
Presentation Transcript
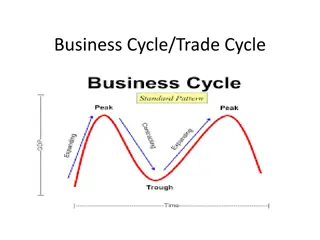
Outlook for 2020 Will the Business Cycle Determine the Election? ? Professor Steven Kyle Cornell University January 17, 2020
538 Blog Economic Index https://fivethirtyeight.blogs.nytimes.com/2012/07/05/measuring-the-effect-of-the-economy-on-elections/
https://fivethirtyeight.blogs.nytimes.com/2012/07/05/measuring-the-effect-of-the-economy-on-elections/https://fivethirtyeight.blogs.nytimes.com/2012/07/05/measuring-the-effect-of-the-economy-on-elections/
Nobody Can Predict the Business Cycle You can do a good job of extrapolating a trend but predicting turning points is really hard This is a case where timing matters a lot. To predict a turning point effectively means picking BOTH a number and a DATE. You could make a lot of money if you could predict the common indicators with any accuracy
Do YOU see signs of a slowdown? Sure, it might be coming but hasnt shown up yet FRED Graph
Grading My Predictions from Last Year Most economists are taught to avoid naming both a number and a date I do it anyway every year and post the results on my website (currently rendered inaccessible to me by the internet powers-that- be) How did I do last time?
GDP growth at around 2 - 2.5% with lower growth possible later in the year
Unemployment Current rate pretty nearly as low as it will go If GDP growth levels off we could see the UE rate around 4% by a year from now
Inflation Will remain relatively low but likely to continue above 2%
Interest rates - Will go up but only a % at a time 3.25% by year end 2019
Exchange Rate: Higher interest rates mean a continued strong dollar
Not My Greatest Year for Predictions I got GDP pretty much spot on Exchange rates and inflation too Everything else was off by a fairly large margin I thought the economy would be showing more weakness by now than it has I really cant give myself anything better than a B+
Measures of Other Things We Care About Though not necessarily directly related to the Fed or Conference Board s leading or coincident data lists, these are things to watch Some data available often (e.g. inflation) Some data not (e.g. GDP)
Industrial Production FRED Graph
Prediction: Art or Science? Want data series that are highly correlated with what happens 6 months or a year later We have the historical data to look for correlations Will they still be important in the future? Will new things emerge?
Feds Index of Leading Indicators FRED Graph
The Yield Curve Has Gotten a Lot of Press Lately Inversion is a BAD sign! FRED Graph
Ten Year vs. 3 Month Was In Negative Territory for a While FRED Graph
New Home Sales Have Been a Good Leading Indicator in the Past (but not in the last downturn)
Consumer Sentiment: Seems to be going sideways at the moment FRED Graph
Upshot? Some indicators look OK and others less so Inverted yield curve the most negative (but timing uncertain) Housing market could be a basis for continued optimism but it isn t always easy to read
Fiscal and Monetary Policy Monetary policy has seen a gradual (but quite small) tightening since 2015 Now reversed and heading back down Fiscal Policy saw a huge tax increase skewed toward the upper incomes but any stimulus from that is probably mostly done Fiscal policy now paralyzed as Congress focuses on impeachment and the election
Fed Funds Rate Target Now 1.5-1.75% - Not Much Room Below FRED Graph
Federal Spending on the Rise After Obama Trend Continues FRED Graph
Factors Unique to the Current Cycle It s a Census Year! So discount the positive employment blip as enumerators are hired and also the negative one at the end of next summer when they are fired again 3.5% unemployment now Can t go a lot lower than that (and cycle is old) Trump s Trade War Uncertainty seems to be more of a problem than direct effects Very easy to overestimate how important any President really is to the Business Cycle Overseas Factors - Mostly negative
Europe and Asia The European Union is definitely slowing down and Brexit could be a very large negative Manufacturing everywhere seems to be already in recession With a large part of our manufacturing sectors now located abroad perhaps there is where to look for the first signs of a slowdown
Manufacturing in China Looking Weak FRED Graph
But There Are Still Positive Signs Too . Unemployment at 3.5% is pretty good Capacity Utilization still at a reasonable level Household Debt low Retail Sales continue to grow but are Durable Goods softening?
Capacity Utilization in High 70s Range (but drifting down ..) FRED Graph
Household Debt Continues at Historically Low Levels FRED Graph
Retail Sales Continue to Rise (Remember, this is 70% of GDP) FRED Graph
Wage Inflation: Not necessarily a bad thing, depending who you are..
And the Chaos in Washington continues . Now spreading to foreign policy!! Nothing would tank the business cycle faster than a disruption in Persian Gulf oil Projection/Prediction? We are in uncharted territory .
While Congress May Be Paralyzed, the Economy Still has Significant Inertia Leading Indicators show no signs of an immediate slowdown Nevertheless, we are likely near a peak in the business cycle Unemployment at 3.5% is unlikely to go much lower
The Big Unknowns Slowdown around the globe? Signs from China and EU are worrying A constitutional crisis? A still worse trade war? Or a resolution of it? Can change on a daily basis !! A real war?
Predictions Predictions with more uncertainty than usual with more uncertainty than usual GDP 1.5% Inflation Continued low around 2% Interest rates Look for continued % rate cuts Fiscal policy paralyzed Unemployment 3.7 - 4% by year end
So Where Are We in the Business Cycle? Even if we can t accurately predict exactly WHEN the cycle turns around (or even know that it has happened until a long time after) we do know a fair amount about what happens DURING a business cycle The Fed s Index of Coincident Indicators is designed to give a picture of current (average) economic conditions You can look it up on FRED
Note These Two Things About That Graph First, there is no set length or time period for the business cycle. No two are exactly the same At the same time, the old saying applies here: Things that can t go on forever generally don t Second, this coincident index is what the Fed (and others) are trying to predict with their Index of Leading Indicators Its components are some of what I personally try to predict annually It is a statistical exercise
Conference Boards Coincident Indicators Coincident Index Employees on nonagricultural payrolls 1. BCI-41 0.2597 Personal income less transfer payments 2. BCI-51 0.1357 3. BCI-47 Industrial production 0.0728 Manufacturing and trade sales 4. BCI-57 0.5318
Conference Boards Leading Indicators Standardization Factor* 1. BCI-01 Average weekly hours, manufacturing 0.2781 Average weekly initial claims for unemployment insurance Manufacturers' new orders, consumer goods and materials 2. BCI-05 0.0334 3. BCI-08 0.0811 4. BCI-130 ISM new order index 0.1651 Manufacturers' new orders, non-defense capital goods excl. aircraft 5. BCI-33 0.0356 6. BCI-29 Building permits, new private housing units 0.0272 7. BCI-19 Stock prices, 500 common stocks 0.0381 8. BCI-107 Leading Credit Index 0.0794 Interest rate spread, 10-year Treasury bonds less federal funds Avg. consumer expectations for business and economic conditions 9. BCI-129 0.1069 10. BCI-125 0.1551