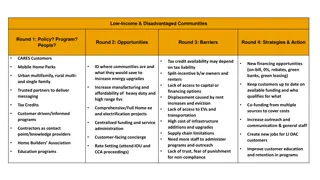
A Changing Metric: Low Income vs. Economically Disadvantaged
Historical data on low-income students in Massachusetts, collected for various purposes including school nutrition, federal entitlement allocations, and research projects. The introduction of the Community Eligibility Provision (CEP) program in 2011 aimed to provide free meals to qualifying students without eligibility forms, leading to benefits such as higher participation, reduced costs, and elimination of stigma and reporting burdens. The landscape of student meal programs continues to evolve to address the needs of economically disadvantaged students.
- Historical data
- Low income
- Student demographics
- Community Eligibility Provision
- Student meal programs

Download Presentation

Please find below an Image/Link to download the presentation.
The content on the website is provided AS IS for your information and personal use only. It may not be sold, licensed, or shared on other websites without obtaining consent from the author. Download presentation by click this link. If you encounter any issues during the download, it is possible that the publisher has removed the file from their server.
E N D
Presentation Transcript
A Changing Metric: Low Income vs. Economically Disadvantaged Revised July 6, 2015
Historical Background ESE has been collecting student demographic data for decades Originally collected in the aggregate; since 2002, collected at the student level through the Student Information Management System (SIMS) One variable collected has been Low Income a student s eligibility for free or reduced price lunch under the National School Lunch Act of 1945 100 Percent of Students Eligible for 90 Free or Reduced Price Lunch 80 70 60 50 38.3 40 25.3 30 2 20 10 0 2002 2003 2004 2005 2006 2007 2008 2009 2010 2011 2012 2013 2014 Massachusetts Department of Elementary and Secondary Education
Historical Background Low Income data have been used for a wide range of purposes School nutrition Chapter 70 Federal entitlement allocations (district and school) State grant awards Assessment reporting Accountability system School building reimbursement rates Research projects consistent across states Participation in NSLP high but not 100% 3 Massachusetts Department of Elementary and Secondary Education
A Changing Landscape In 2011-12 school year, the U.S. Department of Agriculture began a three year pilot of the Community Eligibility Provision (CEP) Program allowed districts or schools that met a certain threshold of qualifying students (40%) to offer free breakfast and lunch to all students without collecting eligibility forms for all students Students are qualified through means other than collecting eligibility forms such as Direct Certification (EOHHS maintained database tracking enrollment in SNAP, TAFDC, foster care and MassHealth) 4 USDA reimbursement for free meals based on 160% of the direct certification count Massachusetts Department of Elementary and Secondary Education
CEP Benefits Higher participation in breakfast and lunch programs Reduced cost to families No stigma in program Eliminates reporting burden for families and schools Eliminates burden of collecting and accounting for lunch fees Loss of lunch fees offset by higher USDA reimbursement and cost savings many districts will come out ahead financially 5 Massachusetts Department of Elementary and Secondary Education
Massachusetts Participation in CEP Massachusetts joined USDA pilot in 2013-14 and Boston public schools served as the pilot district Starting in 2014-15, the program was available to all districts Number of Districts Participating 1 22 54* Percent of State Enrollment 6% 15% 41% School Year Number of Students 2013-14 2014-15 2015-16 57,000 142,000 390,000 6 * Based on eligibility actual number to be determined Massachusetts Department of Elementary and Secondary Education
Defining a New Metric -- Considerations Consistent across all districts (CEP and non-CEP) Accurate Verifiable Student-level 7 Minimize administrative burden Massachusetts Department of Elementary and Secondary Education
Defining a New Metric -- Options Potential Option Considerations Additional burden on districts implementing CEP No incentive for families to report 1. Require CEP districts to collect income data from all students Doesn t provide student level data Doesn t align with district boundaries 2. Use census poverty data Privacy issues Not all low income families file 3. Use state revenue data Results in lower poverty numbers Break in trend data 4. Match against the Direct Certification database Allowable use by the USED and USDA (160%) Doesn t provide a student by student accounting 5. Multiply the Direct Certification count by a factor to approximate the low income count 8 Consistent with current definition Windfall for CEP districts Reduces usefulness of metric 6. Classify all students in CEP districts as low income
What are Other States Doing? Delaware Implement Community Eligibility and move away from collecting income forms Use Direct Certification percentage as a new metric California Continue requirement to collect income forms for all students Allow one form to be active record for four years if no substantive change Kentucky and Michigan Require annual collection of income forms for all students We expect that USED will eventually recommend a new standard after these and other options are studied over a period of years 9 Massachusetts Department of Elementary and Secondary Education
How It Works ESE collaborates with EOHHS to match all enrolled students against the Direct Certification database Matches students that are participating in SNAP, TAFDC, foster care or MassHealth (up to 130% of poverty) Match is run three times a year (October 1, March 1 and end of year) Result is a student by student classification of economically disadvantaged status 10 Massachusetts Department of Elementary and Secondary Education
How do the Results Compare? # of Students Enrolled 955,739 Number Classified 365,885 Percent Classified 38.3% Year Measure 2013-14 Low Income 2014-15 Economically Disadvantaged 955,844 251,026 26.3% Statewide percentage decreased by 12 percentage points 31.4% reduction in the number of students Differentiated impact across districts Of the ten districts with the highest relative share of the low income population in 2014, nine of the ten are still in the top ten of relative share with the new metric 11 Massachusetts Department of Elementary and Secondary Education
Specific District Impacts 2014 Top 10 Highest # of Low Income 2014 Low Income # 22,556 9,635 8,080 17,923 12,474 365,885 10,540 42,169 11,933 13,722 5,506 2015 Econ. Disadv. # 17,330 6,984 5,799 12,478 8,572 251,026 6,896 26,754 6,870 7,892 2,882 % District Change -23.2% -27.5% -28.2% -30.4% -31.3% -31.4% -34.6% -36.6% -42.4% -42.5% -47.7% Springfield New Bedford Fall River Worcester Lawrence State Lowell Boston Lynn Brockton Everett 12 Massachusetts Department of Elementary and Secondary Education
Specific Program Impacts First Year of Impact Use of Data Current Solution Using low income data for FY16 Recommend adjustments to low income increments in FY17 to offset changes Subject to legislative and governor approval Use economically disadvantaged data in FY16 calculations Community allocations are based on census data Hold harmless provisions (Title I) Use economically disadvantaged data in FY16 Developing strategy around longitudinal comparisons Chapter 70 Charter school tuition FY17 Federal entitlement grants FY16 Accountability system FY16 13 Massachusetts Department of Elementary and Secondary Education
Specific Program Impacts First Year of Impact Use of Data Current Solution District choice not required by ESE Report economically disadvantaged data on ESE website (consistent across all districts) Providing technical assistance to the MSBA Working with researchers on how to use the data and identify ways to bridge the change in metrics Local use of data FY16 Public reporting FY16 School Building Authority FY16 Research projects FY16 14 Massachusetts Department of Elementary and Secondary Education