Climate Justice & Disadvantaged Communities: Environmental Issues in US EPA Region 2
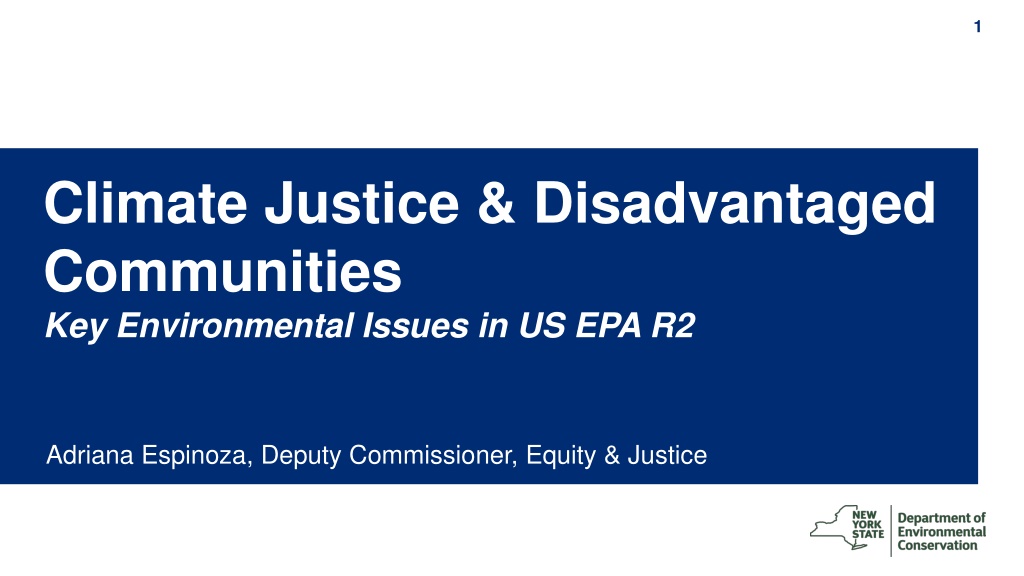
Climate justice and the impact on disadvantaged communities are key environmental issues addressed by Adriana Espinoza, Deputy Commissioner for Equity & Justice in US EPA Region 2. The initiative identifies and prioritizes disadvantaged communities based on multiple criteria, including environmental pollution, socioeconomic factors, and climate change risks. The process involves the formation of a working group, public input, drafting criteria, assessment, and finalization. The finalized criteria focus on 45 indicators to direct investments in clean energy and energy efficiency, with a special emphasis on areas burdened by environmental pollution, climate change risks, and health vulnerabilities.

Download Presentation

Please find below an Image/Link to download the presentation.
The content on the website is provided AS IS for your information and personal use only. It may not be sold, licensed, or shared on other websites without obtaining consent from the author. Download presentation by click this link. If you encounter any issues during the download, it is possible that the publisher has removed the file from their server.
E N D
Presentation Transcript
1 1 Climate Justice & Disadvantaged Communities Key Environmental Issues in US EPA R2 Adriana Espinoza, Deputy Commissioner, Equity & Justice
2 Disadvantaged Communities Description Disadvantaged Communities means communities that bear burdens of negative public health effects, environmental pollution, impacts of climate change, and possess certain socioeconomic criteria, or comprise high-concentrations of low- and moderate- income households. (ECL 75-0101(5)) ECL 75-0111(1)(c) Disadvantaged communities shall be identified based on geographic, public health, environmental hazard, and socioeconomic criteria, which shall include but are not limited to: i. Areas burdened by cumulative environmental pollution and other hazards that can lead to negative public health effects; ii. Areas with concentrations of people that are of low income, high unemployment, high rent burden, low levels of home ownership, low levels of educational attainment, or members of groups that have historically experienced discrimination on the basis of race or ethnicity; and iii. Areas vulnerable to the impacts of climate change such as flooding, storm surges, and urban heat island effects.
3 Disadvantaged Communities Process August 13, 2020 December 13, 2021 March 9, 2022 October 2022- February 2023 March 27, 2023 CJWG Formed & DAC Process Begins Draft Criteria Released for Public Input Draft DAC Criteria Voted on CJWG Assessed Comments CJWG Finalizes DAC Criteria
4 Final DAC Criteria: Summary The criteria are an index of 45 indicators spanning areas burdened by environmental pollution and climate change risks, socio-economic factors, and health vulnerabilities. CJWG voted to change methodology used to determine the threshold percentages from multiplication to addition In addition to geographic DACs, the criteria includes low-income households located anywhere in the State for the purpose of directing clean energy and energy efficiency investments 19 Tribal and Indigenous lands are automatically included where >5% of tract are reservation territory or nation-owned.
5 Environmental Burdens and Climate Change Risks: (20) Land use and facilities associated with historical discrimination or disinvestment Remediation Sites (e.g., NPL Superfund or State Superfund/Class II sites) Regulated Management Plan (chemical) sites Major oil storage facilities (incl. airports) Power generation facilities Active landfills Municipal waste combustors Scrap metal processors Industrial/manufacturing/mining land use (zoning) Housing vacancy rate Potential Pollution Exposures Potential Climate Change Risks Vehicle traffic density Diesel truck and bus traffic Particulate Matter (PM2.5) Benzene concentration Wastewater discharge Extreme heat projections (>90 days in 2050) Flooding in coastal and tidally influenced areas (projected) Flooding in inland areas (projected) Low vegetative cover Agricultural land Driving time to hospitals or urgent/critical care
6 Population Characteristics and Health Vulnerabilities: (25) Income, Education & Employment Housing, Energy, Communications Race, Ethnicity & Language Health Impacts & Sensitivities Asthma ED visits COPD ED visits Heart attack (MI) hospitalization Premature Deaths Low Birthweight Pct without Health Insurance Pct with Disabilities Pct Adults age 65+ Pct Latino/a or Hispanic Pct Black or African American Pct Asian Pct Native American or Indigenous Limited English Proficiency Historical redlining score Pct <80% Area Median Income Pct <100% of Federal Poverty Line Pct without Bachelor s Degree Unemployment rate Pct Single-parent households Pct Renter-Occupied Homes Housing cost burden (rental costs) Energy Poverty / Cost Burden Manufactured homes Homes built before 1960 Pct without Internet (home or cellular) Within this factor, both income metrics have 2x weight Within this factor, Pct Latino/a and Pct Black have 2x weight
7 Regional Breakdown Region Percentage of tracts within regions identified as DACs 44% 14% 42% 34% 35% 21% 35% 22% 26% 14% 35% New York City Long Island Mid-Hudson Western NY Finger Lakes Capital Region Central NY Southern Tier Mohawk Valley North Country Total The CJWG used 45 indicators to identify 35 percent of New York as DACs. Regions correspond with New York State s Regional Economic Development Council regions.
8 Comparison to Justice 40 Tool Comparison between CEJST and NYS DAC Criteria % of Census Tracts Included in Both CEJST Region % Census Tracts Covered by Region 19% % Difference NYS and CJEST (Absolute Values) 3% Census Tracts Covered by Region Alignment on 78% of census tracts in NYS Capital Region 53 88% Central NY 76 35% 84% 0% Differences in data and methodology to identify communities as disadvantaged Finger Lakes 90 29% 89% 6% Long Island 47 8% 90% 7% Mid-Hudson 104 19% 69% 23% Mohawk Valley 56 38% 82% 11% New York City 1,127 52% 72% 8% North Country 33 30% 74% 15% Southern Tier 62 36% 78% 14% Western NY 126 34% 85% 78% 0% Grand Total 1,773 36% 1%
9 9 Disadvantaged Communities Criteria Statutory Requirements
10 DAC Criteria in the Climate Act ECL 75-0111(1)(b) The [climate justice] working group, in consultation with the department, the departments of health and labor, the New York state energy and research development authority, and the environmental justice advisory group, will establish criteria to identify disadvantaged communities for the purposes of co-pollutant reductions, greenhouse gas emissions reductions, regulatory impact statements, and the allocation of investmentsrelated to this article
11 DAC Criteria in the Climate Act ECL 75-0117 "State agencies, authorities and entities, in consultation with the environmental justice working group and the climate action council, shall, to the extent practicable, invest or direct available and relevant programmatic resources in a manner designed to achieve a goal for disadvantaged communities to receive forty percent of overall benefits of spending on clean energy and energy efficiency programs, projects or investments in the areas of housing, workforce development, pollution reduction, low income energy assistance, energy, transportation and economic development, provided however, that disadvantaged communities shall receive no less than thirty-five percent of the overall benefits of spending on clean energy and energy efficiency programs, projects or investments and provided further that this section shall not alter funds already contracted or committed as of the effective date of this section."
12 DAC Criteria in the Climate Act Climate Act Section 7(3) In considering and issuing permits, licenses, and other administrative approvals and decisions, including but not limited to the execution of grants, loans, and contracts, pursuant to article 75 of the environmental conservation law, all state agencies, offices, authorities, and divisions shall not disproportionately burden disadvantaged communities as identified pursuant to subdivision 5 of section 75 0101 of the environmental conservation law. All state agencies, offices, authorities, and divisions shall also prioritize reductions of greenhouse gas emissions and co-pollutants in disadvantaged communities as identified pursuant to such subdivision 5 of section 75 0101 of the environmental conservation law.
13 Thank you
14 Appendix
15 Final DAC Criteria: Methodology The Geographic DAC scoring approach uses 45 indicators in the following categories. For each indicator, the percentile-rank of each census tract is used in scoring. We take each factor score and add them up within the larger component score. Then add the component scores together. Environmental Burdens and Climate Change Risks Population Characteristics and Health Vulnerabilities Land use assoc. with historical discrimination or disinvestment Potential Pollution Exposures Potential Climate Change Risks Housing, Energy, Communications Health Impacts & Burdens Income Race/Ethnicity 20 Indicators in this component 25 Indicators in this component Factor scores are weighted and added before multiplying: 1x 1x 2x 1x 1x 1x 1x Climate Risks are given double weight within Component to equalize the combined weights of Environmental factors (Pollution Exposures + Land Use) with Climate. 19 Tribal and Indigenous lands (census tracts) are automatically included in the Disadvantaged Community definition where 5% or more a designated tract are reservation territory or nation-owned.
16 Designation: Include 35% of Tracts CJWG considered including 35% of census tracts in New York as Geographic Disadvantaged Communities 35% 65% 1,736 of New York s 4,918 census tracts identified as Geographic DACs.
17 Designation: Low Household Counts 138 of 4,918 tracts (2.8%) have household counts that are too low for reliable Census data Implemented as <300 households or <500 people This includes sparsely-populated areas as well as group quarters like correctional facilities where there is no household data on things like household income Of these 138 tracts, 85 have <100 people (and 64 have zero population). Of the remaining 53 tracts with at least 100 people: They are scored on the basis of Environmental/Climate Burdens alone (if their Burdens score fall in the top 28.9% statewide or top 28.9% for NYC or Rest-of-State, using the same designation level as overall scoring) This adds ~12 tracts with low household counts to the DAC definition (This means 81 tracts are not part of scoring - 4 of the 85 are Tribal/Indigenous Land)
18 Low-Income Households Criteria *Estimations were made using 200% FPL as a proxy for 60% SMI as there was no granular 60% SMI data source and 200% FPL most closely aligned with the income thresholds.