Attendance and Chronic Absenteeism Patterns in Washoe County School District
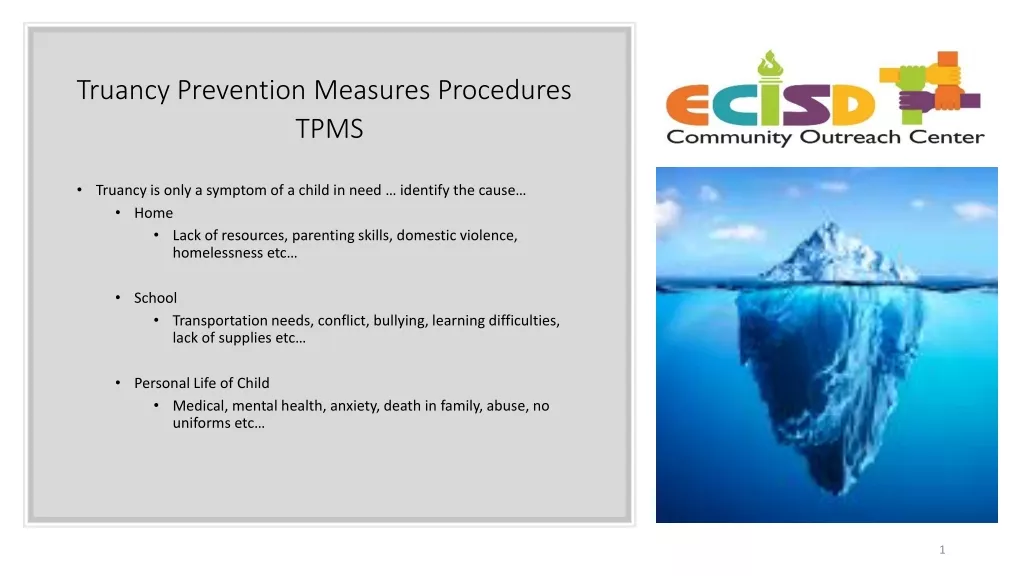
Analysis of attendance data from Washoe County School District reveals concerning rates of chronic absenteeism, particularly among homeless students. The visuals depict the extent of absenteeism, its impact on graduation rates, and how different student subgroups are affected. Homeless students are disproportionately affected by chronic absenteeism, highlighting the need for targeted interventions to support their educational outcomes.

Download Presentation

Please find below an Image/Link to download the presentation.
The content on the website is provided AS IS for your information and personal use only. It may not be sold, licensed, or shared on other websites without obtaining consent from the author. Download presentation by click this link. If you encounter any issues during the download, it is possible that the publisher has removed the file from their server.
E N D
Presentation Transcript
Chronic Absenteeism in the Washoe County School District: Focus on Homelessness CIT Liaison Meeting - April 17, 2018
Chronic absenteeism = Missing 10% or more of days enrolled. Includes: Excused & unexcused absences Partial days (i.e. half days) Equates to missing 2 days every month or 18 days over 180 day school year. Excludes: School business & other exempted absences
2016-17 Attendance Among WCSD Students 3% Most students attended regularly; 12% however... 15 percent of students were chronically absent in 2016-17. 85% Satisfactory (less than 10% days absent) (n=55062) Chronic (10-19% days absent) (n=7801) Severe Chronic (20% or more days absent) (n=1911)
Percent of Class of 2017 who Graduated and Did Not Graduate by Number of Years Chronically Absent in High School. 98% 100% 87% 75% 80% 61% 56% 60% 44% 39% 40% 25% 20% 13% 2% 0% Not Chronically Absent 1 year 2 years 3 years 4 years Graduated (n=3530) Did Not Graduate (n=413)
Percent of WCSD Students Chronically Absent by Subgroup, 2016-17. 40% 35% 36% of students who experienced homelessness last year missed 10 percent or more of days enrolled. 30% 25% 24% 20% 15% 18% 16% 10% 13% 12% 12% 12% 11% 9% 12% 5% 7% 6% 4% 3% 3% 3% 3% 3% 2% 1% 0% Severe Chronic (20% or more days absent) Chronic (10-19% days absent)
Percent of WCSD Students Experiencing Homelessness Chronically Absent by Shelter Type, 2016-17. 45% 40% 35% 30% 26% 19% 24% 25% 25% 20% 21% 15% 10% 18% 16% 14% 11% 5% 9% 0% Hotels/Motels (n=332) Unaccompanied (n=378) Unsheltered (n=57) Doubled-Up (n=1210) Shelters & Transitional Housing (n=409) Severe Chronic (20% or more) Chronic (10-19%)
Percent of Class of 2017 Chronically Absent One or More Years in High School by Special Population. Students who experience homelessness are 2.2 times more likely to be chronically absent than non-homeless students. Gifted 20% Non-Gifted 36% Special Education 47% Non-Special Education 32% English Learner 49% Non-English Learner 33% Free or Reduced Priced Lunch 46% Non-Free or Reduced Priced Lunch 23% Homeless 71% Non-Homeless 32% 0% 20% 40% 60% 80% Note. Line indicates 33% of 2017 cohort members were chronically absent at least one year in grades 9- 12. Includes adjusted cohort members enrolled all four years enrolled for at least 20 days each year.
Percent of Class of 2017 Chronically Absent One or More Years in High School by Race and Homeless Status. 71% All Students 32% American Indian 43% Pacific Islander 42% 75% Hispanic 39% 67% Black 38% 73% Multi-Racial 29% 70% White 28% 46% Asian 11% 0% 10% 20% 30% 40% 50% 60% 70% 80% Homeless Housed Note. Line indicates 33% of 2017 cohort members were chronically absent at least one year in grades 9-12. Includes adjusted cohort members enrolled all four years enrolled for at least 20 days each year.
Percent of Class of 2017 Who Did and Did Not Graduate Among Students Chronically Absent 1 or More Years in High School by Homeless Status. Gifted & Chronically Absent 93% 8% Disability & Chronically Absent 43% 57% English Learner & Chronically Absent 57% 43% FRL & Chronically Absent 69% 31% Homeless & Chronically Absent 54% 46% 0% 20% 40% 60% 80% 100% Graduated Did Not Graduate
Percent of Class of 2017 Who Did and Did Not Graduate Among Students Chronically Absent 1 or More Years in High School by Homeless Status. Homeless & Chronically Absent 54% 46% Not Homeless & Chronically Absent 76% 24% 0% 20% 40% 60% 80% 100% Graduated Did Not Graduate Chronically absent students who experience homelessness are less likely to graduate than those who are not homeless by a difference of 22 percentage points.
Percent of Class of 2017 Who Graduated by Number of Years Chronically Absent in High School and Homeless Status. 98% 100% 91% 89% 77% 69% 75% 66% 64% 58% 49% 50% 40% 25% 0% Not Chronically Absent 1 year 2 years 3 years 4 years Housed - Graduated (n=3385) Homeless - Graduated (n=145)
Percent of Class of 2017 Who Did Not Graduate by Number of Years Chronically Absent in High School and Homeless Status. 100% Students who experience homelessness are less likely to graduate than their housed peers regardless of number of years chronically absent in high school. 75% 61% 51% 50% 42% 36% 34% 31% 23% 25% 11% 9% 2% 0% Not Chronically Absent 1 year 2 years 3 years 4 years Housed - Did Not Graduate (n=334) Homeless - Did Not Graduate (n=79)
Percent of WCSD Students Chronically Absent by Disability and Homeless Status, 2016-17. Emotional Disturbance: Homeless 19% 36% Emotional Disturbance: Housed 16% 24% Autism Spectrum Disorder: Homeless 18% 32% Autism Spectrum Disorder: Housed 5% 17% Intellectual Disability - Homeless 43% 0% Intellectual Disability: Housed 9% 22% Health Impairment: Homeless 14% 21% Health Impairment: Housed 6% 20% Specific Learning Disability: Homeless 14% 21% Specific Learning Disability: Housed 5% 16% Speech/Language Impairment: Homeless 9% 25% Speech/Language Impairment: Housed 1% 13% 0% 10% 20% 30% 40% 50% 60% Severe Chronic (20% or more days absent) Chronic (10-19% days absent)
Percent Students With Disabilities in Class of 2017 Who Did and Did Not Graduate by Homeless Status and Chronic Absence. 100% 13% 80% 50% 55% 66% 60% 87% 40% 50% 45% 20% 34% 0% Housed & Not Chronically Absent (n=225) Homeless & Not Chronically Absent (n=10) Housed and Chronically Absent (n=172) Homeless & Chronically Absent (n=35) Graduated Did Not Graduate Note Includes adjusted cohort members with disabilities enrolled all four years in high school at least 20 days each year.
Discussion Questions 1. What contributes to chronic absenteeism among students experiencing homelessness? 2. What can schools do to reduce chronic absenteeism among students in CIT? 3. How can students in CIT help reduce chronic absence in their schools? Be enlisted to serve as co-researchers to explore this issue?
Additional Information For questions about this presentation, please contact Jennifer Harris, Program Evaluator at jharris@washoeschools.net or visit the Office of Accountability at https://www.washoeschools.net/Domain/166 Please visit the following WCSD departments for additional information on attendance support: Intervention Department https://www.washoeschools.net/Page/5579 Multi-Tiered System of Supports Department https://www.washoeschools.net/Domain/202 Student Accounting https://www.washoeschools.net/Domain/180