Wisconsin 2022 School Health Profiles Report
The Wisconsin 2022 School Health Profiles Report presents survey results on the percentage of schools requiring health education courses, the distribution of required courses by grade, materials provided to health education teachers, and skills addressed in the health education curriculum. The data offers insights into the current state of health education in Wisconsin schools.

Download Presentation

Please find below an Image/Link to download the presentation.
The content on the website is provided AS IS for your information and personal use only. It may not be sold, licensed, or shared on other websites without obtaining consent from the author. Download presentation by click this link. If you encounter any issues during the download, it is possible that the publisher has removed the file from their server.
E N D
Presentation Transcript
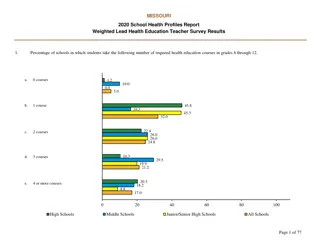
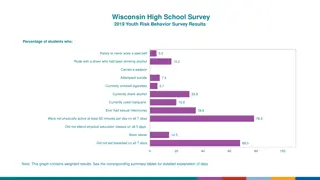
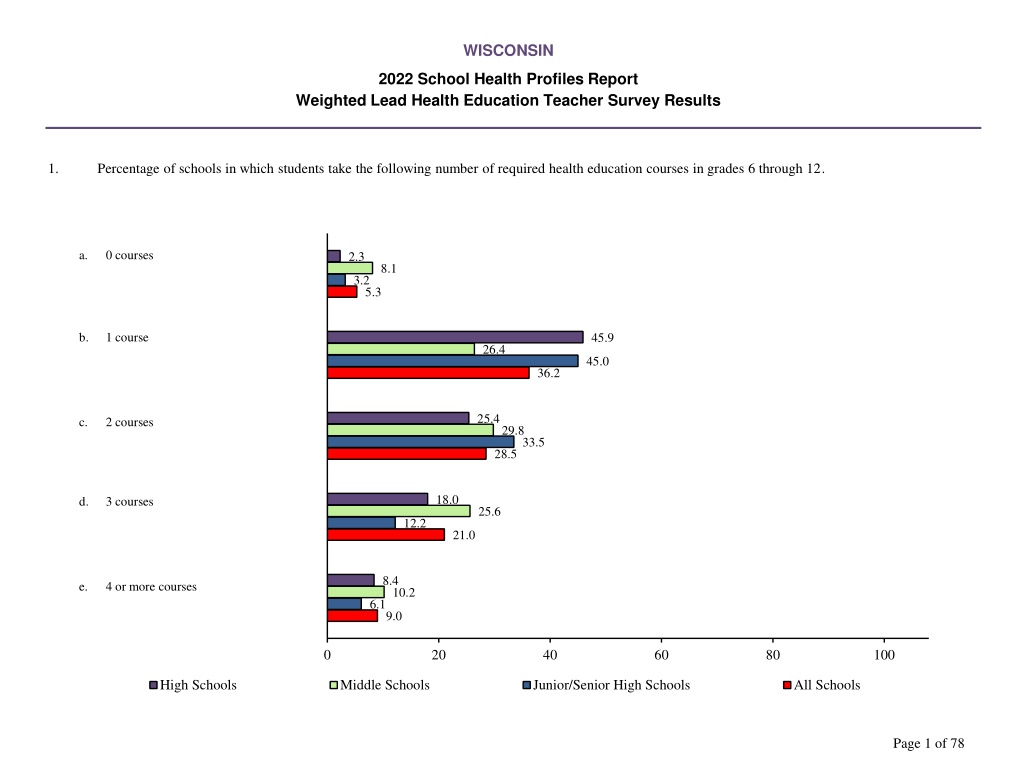
WISCONSIN 2022 School Health Profiles Report Weighted Lead Health Education Teacher Survey Results 1. Percentage of schools in which students take the following number of required health education courses in grades 6 through 12. a. 0 courses 2.3 8.1 3.2 5.3 b. 1 course 45.9 26.4 45.0 36.2 25.4 c. 2 courses 29.8 33.5 28.5 18.0 d. 3 courses 25.6 12.2 21.0 8.4 e. 4 or more courses 10.2 6.1 9.0 0 20 40 60 80 100 High Schools Middle Schools Junior/Senior High Schools All Schools Page 1 of 78
WISCONSIN 2022 School Health Profiles Report Weighted Lead Health Education Teacher Survey Results 1N. Percentage of schools that require students to take two or more health education courses. 51.8 65.6 51.8 58.6 0 20 40 60 80 100 High Schools Middle Schools Junior/Senior High Schools All Schools Page 2 of 78
WISCONSIN 2022 School Health Profiles Report Weighted Lead Health Education Teacher Survey Results 2. Percentage of schools that taught a required health education course in each of the following grades.* NA a. Grade 6 55.8 32.9 53.6 NA 68.5 b. Grade 7 53.4 66.3 NA 61.2 c. Grade 8 60.5 61.1 0 20 40 60 80 100 High Schools Middle Schools Junior/Senior High Schools All Schools *Among schools with students in that grade. NA = Not available Page 3 of 78
WISCONSIN 2022 School Health Profiles Report Weighted Lead Health Education Teacher Survey Results 2. Percentage of schools that taught a required health education course in each of the following grades.* d. Grade 9 66.1 NA 70.3 67.0 56.7 e. Grade 10 NA 41.1 53.3 22.9 f. Grade 11 NA 21.8 22.7 25.3 g. Grade 12 NA 24.8 25.2 0 20 40 60 80 100 High Schools Middle Schools Junior/Senior High Schools All Schools *Among schools with students in that grade. NA = Not available Page 4 of 78
WISCONSIN 2022 School Health Profiles Report Weighted Lead Health Education Teacher Survey Results 3. Percentage of schools in which those who teach health education are provided with each of the following materials.* a. Goals, objectives, and expected outcomes for health education 91.4 81.7 86.6 86.0 b. A chart describing the annual scope and sequence of instruction for health education 64.9 62.1 76.1 64.7 72.3 c. Plans for how to assess student performance in health education 66.2 76.1 69.7 74.1 d. A written health education curriculum 71.3 79.9 73.3 74.6 e. Written instructional competencies for health education teachers (i.e., the essential knowledge and skills teachers need to be effective educators) 69.6 77.8 72.5 0 20 40 60 80 100 High Schools Middle Schools Junior/Senior High Schools All Schools *Among schools that teach health education. Respondents that answered "NA" are excluded. Page 5 of 78
WISCONSIN 2022 School Health Profiles Report Weighted Lead Health Education Teacher Survey Results 4. Percentage of schools in which the health education curriculum addresses each of the following skills. a. Comprehending concepts related to health promotion and disease prevention to enhance health 99.2 90.1 100.0 94.7 99.2 b. Analyzing the influence of family, peers, culture, media, technology, and other factors on health behaviors 89.3 100.0 94.3 98.4 c. Accessing valid information and products and services to enhance health 87.2 100.0 93.0 99.2 d. Using interpersonal communication skills to enhance health and avoid or reduce health risks 90.6 100.0 95.0 0 20 40 60 80 100 High Schools Middle Schools Junior/Senior High Schools All Schools Page 6 of 78
WISCONSIN 2022 School Health Profiles Report Weighted Lead Health Education Teacher Survey Results 4. Percentage of schools in which the health education curriculum addresses each of the following skills. e. Using decision-making skills to enhance health 99.2 91.4 100.0 95.4 96.7 f. Using goal-setting skills to enhance health 88.7 97.5 92.8 97.5 g. Practicing health-enhancing behaviors to avoid or reduce risks 90.6 100.0 94.4 97.5 h. Advocating for personal, family, and community health 90.8 95.1 93.9 0 20 40 60 80 100 High Schools Middle Schools Junior/Senior High Schools All Schools Page 7 of 78
WISCONSIN 2022 School Health Profiles Report Weighted Lead Health Education Teacher Survey Results 5. Percentage of schools in which those who teach sexual health education are provided with each of the following materials.* 77.0 a. An approved health education scope and sequence that includes learning objectives, outcomes, and content to guide sexual health education instruction 71.7 86.5 75.4 77.1 69.8 b. A written health education curriculum that includes objectives and content addressing sexual health education 80.8 73.9 56.4 52.6 c. Teacher pacing guides for sexual health education (i.e., schedules that regulate a teacher s pace of the unit or curriculum) 65.1 55.4 0 20 40 60 80 100 High Schools Middle Schools Junior/Senior High Schools All Schools *Among schools that teach sexual health education. Page 8 of 78
WISCONSIN 2022 School Health Profiles Report Weighted Lead Health Education Teacher Survey Results 5. Percentage of schools in which those who teach sexual health education are provided with each of the following materials.* 80.3 d. Teaching resources (e.g., lesson plans, handouts) to support sexual health education instruction 74.6 80.8 77.5 83.1 76.4 e. Strategies that are age-appropriate, relevant, and actively engage students in learning 79.8 79.5 80.1 69.1 f. Methods to assess student knowledge and skills related to sexual health education 77.4 74.4 0 20 40 60 80 100 High Schools Middle Schools Junior/Senior High Schools All Schools *Among schools that teach sexual health education. Page 9 of 78
WISCONSIN 2022 School Health Profiles Report Weighted Lead Health Education Teacher Survey Results 6. Percentage of schools in which health education instruction is required for students in any of grades 6 through 12. 100.0 95.5 100.0 97.7 0 20 40 60 80 100 High Schools Middle Schools Junior/Senior High Schools All Schools Page 10 of 78
WISCONSIN 2022 School Health Profiles Report Weighted Lead Health Education Teacher Survey Results 7. Percentage of schools in which teachers tried to increase student knowledge on each of the following topics in a required course in any of grades 6 through 12 during the current school year. a. Alcohol- or other drug-use prevention 99.2 95.8 96.8 97.2 b. Asthma 51.1 45.9 50.2 48.4 93.9 c. Chronic disease prevention (e.g., diabetes, obesity prevention) 87.8 90.5 90.5 45.1 d. Epilepsy or seizure disorder 34.5 48.9 40.3 68.8 e. Food allergies 67.1 69.1 68.0 0 20 40 60 80 100 High Schools Middle Schools Junior/Senior High Schools All Schools Page 11 of 78
WISCONSIN 2022 School Health Profiles Report Weighted Lead Health Education Teacher Survey Results 7. Percentage of schools in which teachers tried to increase student knowledge on each of the following topics in a required course in any of grades 6 through 12 during the current school year. f. Foodborne illness prevention 70.2 61.0 59.5 64.4 g. Human immunodeficiency virus (HIV) prevention 94.6 83.9 93.2 89.2 95.1 h. Human sexuality 84.6 86.9 89.0 93.2 i. Infectious disease prevention (e.g., influenza [flu] or COVID-19 prevention) 87.8 94.4 90.7 84.7 j. Injury prevention and safety 83.9 94.3 85.4 0 20 40 60 80 100 High Schools Middle Schools Junior/Senior High Schools All Schools Page 12 of 78
WISCONSIN 2022 School Health Profiles Report Weighted Lead Health Education Teacher Survey Results 7. Percentage of schools in which teachers tried to increase student knowledge on each of the following topics in a required course in any of grades 6 through 12 during the current school year. k. Mental and emotional health 100.0 98.6 100.0 99.3 l. Nutrition and dietary behavior 99.2 98.6 100.0 99.0 99.2 m. Physical activity and fitness 98.6 100.0 99.0 94.7 n. Pregnancy prevention 80.9 86.8 87.0 97.7 o. Sexually transmitted disease (STD) prevention 82.6 96.8 90.2 0 20 40 60 80 100 High Schools Middle Schools Junior/Senior High Schools All Schools Page 13 of 78
WISCONSIN 2022 School Health Profiles Report Weighted Lead Health Education Teacher Survey Results 7. Percentage of schools in which teachers tried to increase student knowledge on each of the following topics in a required course in any of grades 6 through 12 during the current school year. p. Sleep health (e.g., how much sleep students need, good sleeping habits) 88.2 86.8 91.2 87.8 98.5 q. Suicide prevention 89.6 91.7 93.3 99.2 r. Tobacco-use prevention or cessation 95.2 96.6 96.9 99.2 s. Violence prevention (e.g., bullying, fighting, dating violence prevention) 96.4 100.0 97.9 0 20 40 60 80 100 High Schools Middle Schools Junior/Senior High Schools All Schools Page 14 of 78
WISCONSIN 2022 School Health Profiles Report Weighted Lead Health Education Teacher Survey Results 8. Percentage of schools in which teachers taught each of the following tobacco-use prevention or cessation topics in a required course for students in any of grades 6 through 12 during the current school year. a. Identifying tobacco products and the harmful substances they contain 95.7 86.5 93.5 90.8 b. Identifying short- and long-term health consequences of tobacco product use 98.3 87.2 97.2 92.5 89.9 c. Identifying social, economic, and cosmetic consequences of tobacco product use 83.5 90.2 86.7 97.7 d. Understanding the addictive nature of nicotine 89.1 93.8 92.9 91.5 e. Effects of nicotine on the adolescent brain 86.9 91.6 89.2 0 20 40 60 80 100 High Schools Middle Schools Junior/Senior High Schools All Schools Page 15 of 78
WISCONSIN 2022 School Health Profiles Report Weighted Lead Health Education Teacher Survey Results 8. Percentage of schools in which teachers taught each of the following tobacco-use prevention or cessation topics in a required course for students in any of grades 6 through 12 during the current school year. f. Effects of tobacco product use on athletic performance 81.5 76.9 87.5 79.8 g. Effects of second-hand smoke and benefits of a smoke-free environment 92.4 81.5 91.0 86.7 94.5 h. Understanding the social influences on tobacco product use, including media, family, peers, and culture 86.8 93.8 90.5 94.4 i. Identifying reasons why students do and do not use tobacco products 86.7 97.2 90.8 73.7 j. Making accurate assessments of how many peers use tobacco products 71.4 88.8 74.1 0 20 40 60 80 100 High Schools Middle Schools Junior/Senior High Schools All Schools Page 16 of 78
WISCONSIN 2022 School Health Profiles Report Weighted Lead Health Education Teacher Survey Results 8. Percentage of schools in which teachers taught each of the following tobacco-use prevention or cessation topics in a required course for students in any of grades 6 through 12 during the current school year. k. Using interpersonal communication skills to avoid tobacco product use (e.g., refusal skills, assertiveness) 92.5 86.9 94.4 89.9 l. Using goal-setting and decision-making skills related to not using tobacco products 79.9 81.2 84.8 81.1 87.0 m. Finding valid information and services related to tobacco-use prevention and cessation 73.8 90.2 80.7 76.8 n. Supporting others who abstain from or want to quit using tobacco products 76.2 87.9 77.7 85.0 o. Identifying harmful effects of tobacco product use on fetal development 71.5 87.9 78.5 0 20 40 60 80 100 High Schools Middle Schools Junior/Senior High Schools All Schools Page 17 of 78
WISCONSIN 2022 School Health Profiles Report Weighted Lead Health Education Teacher Survey Results 8. Percentage of schools in which teachers taught each of the following tobacco-use prevention or cessation topics in a required course for students in any of grades 6 through 12 during the current school year. p. Relationship between using tobacco products and alcohol or other drugs 92.4 84.5 94.4 88.6 86.6 q. How addiction to tobacco products can be treated 76.3 85.1 81.3 87.3 r. Understanding school policies and community laws related to the sale and use of tobacco products 78.8 91.6 83.4 63.8 s. Benefits of tobacco product cessation programs 60.1 82.3 63.8 0 20 40 60 80 100 High Schools Middle Schools Junior/Senior High Schools All Schools Page 18 of 78
WISCONSIN 2022 School Health Profiles Report Weighted Lead Health Education Teacher Survey Results 8N. Percentage of schools that taught all 19 tobacco-use prevention topics during the current school year.* 48.9 43.9 70.4 48.7 0 20 40 60 80 100 High Schools Middle Schools Junior/Senior High Schools All Schools *Responses to question 8 a through s all are "yes." Page 19 of 78
WISCONSIN 2022 School Health Profiles Report Weighted Lead Health Education Teacher Survey Results 9. Percentage of schools in which teachers taught about the following tobacco products in a required course for students in any of grades 6 through 12 during the current school year. a. Cigarettes 98.3 88.8 97.2 93.4 b. Smokeless tobacco (e.g., chewing tobacco, snuff, dip, snus, dissolvable tobacco) 98.3 85.5 97.2 91.7 74.4 c. Cigars, little cigars, or cigarillos 71.3 90.7 74.5 63.6 d. Pipes 60.6 80.8 63.8 98.3 e. Electronic vapor products (e.g., e- cigarettes, vapes, vape pens, e-hookahs, mods, or brands such as JUUL) 89.5 97.2 93.7 0 20 40 60 80 100 High Schools Middle Schools Junior/Senior High Schools All Schools Page 20 of 78
WISCONSIN 2022 School Health Profiles Report Weighted Lead Health Education Teacher Survey Results 10. Percentage of schools in which teachers taught each of the following alcohol- and other drug-use prevention topics in a required course for students in any of grades 6 through 12 during the current school year. a. Differences between proper use and abuse of over-the-counter medicines and prescription medicines 93.2 83.8 93.8 88.5 b. Harmful short- and long-term physical, psychological, and social effects of using alcohol and other drugs 98.3 89.3 97.3 93.6 96.7 c. Situations that lead to the use of alcohol and other drugs 88.2 100.0 92.8 70.4 d. Alcohol and other drug use as an unhealthy way to manage weight 61.0 85.6 67.3 97.5 e. Identifying reasons why individuals choose to use or not to use alcohol and other drugs 88.0 97.3 92.7 0 20 40 60 80 100 High Schools Middle Schools Junior/Senior High Schools All Schools Page 21 of 78
WISCONSIN 2022 School Health Profiles Report Weighted Lead Health Education Teacher Survey Results 10. Percentage of schools in which teachers taught each of the following alcohol- and other drug-use prevention topics in a required course for students in any of grades 6 through 12 during the current school year. f. Using interpersonal communication skills to avoid alcohol and other drug use (e.g., refusal skills, assertiveness) 94.3 86.6 94.6 90.5 86.4 g. Supporting others who abstain from or want to quit using alcohol and other drugs 77.2 91.0 82.3 97.5 h. Understanding the social influences on alcohol and other drug use, including media, family, peers, and culture 86.9 97.3 92.1 88.0 i. How to persuade and support others to be alcohol and other drug free 82.6 93.8 85.9 0 20 40 60 80 100 High Schools Middle Schools Junior/Senior High Schools All Schools Page 22 of 78
WISCONSIN 2022 School Health Profiles Report Weighted Lead Health Education Teacher Survey Results 11. Percentage of schools in which teachers taught each of the following sexual health topics in a required course for students in any of grades 6, 7, or 8 during the current school year. a. How HIV and other STDs are transmitted NA 74.0 59.7 71.8 b. Health consequences of HIV, other STDs, and pregnancy NA 74.0 63.5 72.4 NA c. The benefits of being sexually abstinent 76.8 72.3 76.1 NA d. How to access valid and reliable health information, products, and services related to HIV, other STDs, and pregnancy 66.2 59.7 65.2 NA e. The influences of family, peers, media, technology and other factors on sexual risk behaviors 72.1 63.5 70.8 0 20 40 60 80 100 High Schools Middle Schools Junior/Senior High Schools All Schools NA = Not available Page 23 of 78
WISCONSIN 2022 School Health Profiles Report Weighted Lead Health Education Teacher Survey Results 11. Percentage of schools in which teachers taught each of the following sexual health topics in a required course for students in any of grades 6, 7, or 8 during the current school year. f. Communication and negotiation skills related to eliminating or reducing risk for HIV, other STDs, and pregnancy NA 70.9 60.9 69.4 g. Goal-setting and decision-making skills related to eliminating or reducing risk for HIV, other STDs, and pregnancy NA 69.5 71.2 69.7 NA h. Influencing and supporting others to avoid or reduce sexual risk behaviors 65.8 61.2 65.1 NA i. Efficacy of condoms, that is, how well condoms work and do not work 64.4 41.4 60.9 NA j. The importance of using condoms consistently and correctly 58.8 45.2 56.7 0 20 40 60 80 100 High Schools Middle Schools Junior/Senior High Schools All Schools NA = Not available Page 24 of 78
WISCONSIN 2022 School Health Profiles Report Weighted Lead Health Education Teacher Survey Results 11. Percentage of schools in which teachers taught each of the following sexual health topics in a required course for students in any of grades 6, 7, or 8 during the current school year. k. How to obtain condoms NA 44.9 45.2 44.9 l. How to correctly use a condom NA 37.0 41.4 37.7 NA m. Methods of contraception other than condoms 60.7 45.2 58.3 NA n. The importance of using a condom at the same time as another form of contraception to prevent both STDs and pregnancy 55.3 49.8 54.4 NA o. How to create and sustain healthy and respectful relationships 75.3 87.5 77.2 0 20 40 60 80 100 High Schools Middle Schools Junior/Senior High Schools All Schools NA = Not available Page 25 of 78
WISCONSIN 2022 School Health Profiles Report Weighted Lead Health Education Teacher Survey Results 11. Percentage of schools in which teachers taught each of the following sexual health topics in a required course for students in any of grades 6, 7, or 8 during the current school year. p. The importance of limiting the number of sexual partners NA 67.8 45.2 64.2 NA q. Preventive care (such as screenings and immunizations) that is necessary to maintain reproductive and sexual health 62.2 54.8 61.0 NA r. How to communicate sexual consent between partners 66.0 59.7 65.0 NA s. Recognizing and responding to sexual victimization and violence 64.1 53.9 62.5 0 20 40 60 80 100 High Schools Middle Schools Junior/Senior High Schools All Schools NA = Not available Page 26 of 78
WISCONSIN 2022 School Health Profiles Report Weighted Lead Health Education Teacher Survey Results 11. Percentage of schools in which teachers taught each of the following sexual health topics in a required course for students in any of grades 6, 7, or 8 during the current school year. NA t. Diversity of sexual orientations and gender identities 55.6 52.4 55.1 NA 58.8 u. How gender roles and stereotypes affect goals, decision making, and relationships 66.2 60.0 NA 70.3 v. The relationship between alcohol and other drug use and sexual risk behaviors 57.7 68.3 0 20 40 60 80 100 High Schools Middle Schools Junior/Senior High Schools All Schools NA = Not available Page 27 of 78
WISCONSIN 2022 School Health Profiles Report Weighted Lead Health Education Teacher Survey Results 11. Percentage of schools in which teachers taught each of the following sexual health topics in a required course for students in any of grades 9, 10, 11, or 12 during the current school year. a. How HIV and other STDs are transmitted 95.6 NA 91.8 94.8 b. Health consequences of HIV, other STDs, and pregnancy 96.5 NA 96.1 96.5 93.9 c. The benefits of being sexually abstinent NA 91.8 93.5 95.7 d. How to access valid and reliable health information, products, and services related to HIV, other STDs, and pregnancy NA 91.8 94.9 89.2 e. The influences of family, peers, media, technology and other factors on sexual risk behaviors NA 92.8 90.0 0 20 40 60 80 100 High Schools Middle Schools Junior/Senior High Schools All Schools NA = Not available Page 28 of 78
WISCONSIN 2022 School Health Profiles Report Weighted Lead Health Education Teacher Survey Results 11. Percentage of schools in which teachers taught each of the following sexual health topics in a required course for students in any of grades 9, 10, 11, or 12 during the current school year. f. Communication and negotiation skills related to eliminating or reducing risk for HIV, other STDs, and pregnancy 91.2 NA 91.8 91.3 g. Goal-setting and decision-making skills related to eliminating or reducing risk for HIV, other STDs, and pregnancy 84.1 NA 91.8 85.6 86.7 h. Influencing and supporting others to avoid or reduce sexual risk behaviors NA 88.6 87.1 92.4 i. Efficacy of condoms, that is, how well condoms work and do not work NA 81.2 90.1 90.2 j. The importance of using condoms consistently and correctly NA 81.2 88.4 0 20 40 60 80 100 High Schools Middle Schools Junior/Senior High Schools All Schools NA = Not available Page 29 of 78
WISCONSIN 2022 School Health Profiles Report Weighted Lead Health Education Teacher Survey Results 11. Percentage of schools in which teachers taught each of the following sexual health topics in a required course for students in any of grades 9, 10, 11, or 12 during the current school year. k. How to obtain condoms 79.0 NA 76.0 78.4 l. How to correctly use a condom 73.5 NA 69.5 72.7 92.4 m. Methods of contraception other than condoms NA 83.4 90.6 86.6 n. The importance of using a condom at the same time as another form of contraception to prevent both STDs and pregnancy NA 80.2 85.3 93.9 o. How to create and sustain healthy and respectful relationships NA 95.9 94.3 0 20 40 60 80 100 High Schools Middle Schools Junior/Senior High Schools All Schools NA = Not available Page 30 of 78
WISCONSIN 2022 School Health Profiles Report Weighted Lead Health Education Teacher Survey Results 11. Percentage of schools in which teachers taught each of the following sexual health topics in a required course for students in any of grades 9, 10, 11, or 12 during the current school year. p. The importance of limiting the number of sexual partners 94.0 NA 83.4 91.9 91.7 q. Preventive care (such as screenings and immunizations) that is necessary to maintain reproductive and sexual health NA 79.2 89.2 90.5 r. How to communicate sexual consent between partners NA 84.4 89.2 90.2 s. Recognizing and responding to sexual victimization and violence NA 80.2 88.2 0 20 40 60 80 100 High Schools Middle Schools Junior/Senior High Schools All Schools NA = Not available Page 31 of 78
WISCONSIN 2022 School Health Profiles Report Weighted Lead Health Education Teacher Survey Results 11. Percentage of schools in which teachers taught each of the following sexual health topics in a required course for students in any of grades 9, 10, 11, or 12 during the current school year. 71.6 t. Diversity of sexual orientations and gender identities NA 72.7 71.8 78.1 NA u. How gender roles and stereotypes affect goals, decision making, and relationships 83.8 79.2 94.9 NA v. The relationship between alcohol and other drug use and sexual risk behaviors 91.8 94.3 0 20 40 60 80 100 High Schools Middle Schools Junior/Senior High Schools All Schools NA = Not available Page 32 of 78
WISCONSIN 2022 School Health Profiles Report Weighted Lead Health Education Teacher Survey Results 11N_1. Percentage of schools that taught all 22 sexual health topics in any of grades 6, 7, or 8 during the current school year.* NA 28.5 36.4 29.7 0 20 40 60 80 100 High Schools Middle Schools Junior/Senior High Schools All Schools *Responses to question 11 a through v all are "yes." NA = Not available Page 33 of 78
WISCONSIN 2022 School Health Profiles Report Weighted Lead Health Education Teacher Survey Results 11N_2. Percentage of schools that taught all 22 sexual health topics in any of grades 9, 10, 11, or 12 during the current school year.* 53.0 NA 53.8 53.1 0 20 40 60 80 100 High Schools Middle Schools Junior/Senior High Schools All Schools *Responses to question 11 a through v all are "yes." NA = Not available Page 34 of 78
WISCONSIN 2022 School Health Profiles Report Weighted Lead Health Education Teacher Survey Results 12. Percentage of schools in which teachers assessed the ability of students to do each of the following in a required course for students in any of grades 6, 7, or 8 during the current school year. a. Comprehend concepts important to prevent HIV, other STDs, and pregnancy NA 69.7 54.8 67.4 NA b. Analyze the influence of family, peers, culture, media, technology, and other factors on sexual risk behaviors 64.3 54.8 62.8 NA c. Access valid information, products, and services to prevent HIV, other STDs, and pregnancy 58.7 46.0 56.8 NA d. Use interpersonal communication skills to avoid or reduce sexual risk behaviors 67.3 54.8 65.3 0 20 40 60 80 100 High Schools Middle Schools Junior/Senior High Schools All Schools NA = Not available Page 35 of 78
WISCONSIN 2022 School Health Profiles Report Weighted Lead Health Education Teacher Survey Results 12. Percentage of schools in which teachers assessed the ability of students to do each of the following in a required course for students in any of grades 6, 7, or 8 during the current school year. NA e. Use decision-making skills to prevent HIV, other STDs, and pregnancy 66.5 54.8 64.7 NA 65.5 f. Set personal goals that enhance health, take steps to achieve these goals, and monitor progress in achieving them 75.0 66.9 NA 61.0 g. Influence and support others to avoid or reduce sexual risk behaviors 59.7 60.8 0 20 40 60 80 100 High Schools Middle Schools Junior/Senior High Schools All Schools NA = Not available Page 36 of 78
WISCONSIN 2022 School Health Profiles Report Weighted Lead Health Education Teacher Survey Results 12. Percentage of schools in which teachers assessed the ability of students to do each of the following in a required course for students in any of grades 9, 10, 11, or 12 during the current school year. a. Comprehend concepts important to prevent HIV, other STDs, and pregnancy 91.8 NA 91.5 91.8 82.9 b. Analyze the influence of family, peers, culture, media, technology, and other factors on sexual risk behaviors NA 83.8 83.1 88.2 c. Access valid information, products, and services to prevent HIV, other STDs, and pregnancy NA 82.8 87.1 87.0 d. Use interpersonal communication skills to avoid or reduce sexual risk behaviors NA 87.1 87.0 0 20 40 60 80 100 High Schools Middle Schools Junior/Senior High Schools All Schools NA = Not available Page 37 of 78
WISCONSIN 2022 School Health Profiles Report Weighted Lead Health Education Teacher Survey Results 12. Percentage of schools in which teachers assessed the ability of students to do each of the following in a required course for students in any of grades 9, 10, 11, or 12 during the current school year. 85.0 e. Use decision-making skills to prevent HIV, other STDs, and pregnancy NA 82.8 84.6 84.1 NA f. Set personal goals that enhance health, take steps to achieve these goals, and monitor progress in achieving them 83.8 84.0 79.6 NA g. Influence and support others to avoid or reduce sexual risk behaviors 81.3 80.0 0 20 40 60 80 100 High Schools Middle Schools Junior/Senior High Schools All Schools NA = Not available Page 38 of 78
WISCONSIN 2022 School Health Profiles Report Weighted Lead Health Education Teacher Survey Results 13. Percentage of schools in which teachers provided students with the opportunity to practice the following skills in a required course for students in any of grades 6 through 12 during the current school year. 83.6 a. Communication, decision-making, goal- setting, or refusal skills related to sexual health (e.g., through role playing) 66.0 87.6 75.1 82.6 72.9 b. Analyzing the influence of family, peers, culture, media, or technology on sexual health 91.0 78.5 84.7 69.0 c. Accessing valid sexual health information, products, and services 96.3 77.9 0 20 40 60 80 100 High Schools Middle Schools Junior/Senior High Schools All Schools Page 39 of 78
WISCONSIN 2022 School Health Profiles Report Weighted Lead Health Education Teacher Survey Results 14. Percentage of schools in which teachers implemented the following inclusive practices when providing sexual health education in a required course for students in grades 6 through 12 during the current school year.* a. Encouraged use of gender-neutral pronouns such as "they/them" during instruction to recognize gender diversity among students 64.4 52.3 80.8 60.4 b. Provided positive examples of lesbian, gay, bisexual, or transgender (LGBT) people and same-sex or gender relationships (e.g., family, peer, or romantic) 55.3 47.2 77.7 54.1 90.3 c. Encouraged students to respect others' sexual and gender identities 85.4 100.0 89.0 Provided students with information about LGBT resources within the school (e.g., counseling services, student support groups like Gay/Straight Alliances or Genders and Sexualities Alliances) d. 64.2 51.1 75.3 59.1 53.4 e. Identified additional LGBT resources available in the community or online 43.2 70.3 50.5 0 20 40 60 80 100 High Schools Middle Schools Junior/Senior High Schools All Schools *Among schools that teach sexual health education. Page 40 of 78
WISCONSIN 2022 School Health Profiles Report Weighted Lead Health Education Teacher Survey Results 15. Percentage of schools in which teachers taught each of the following nutrition and dietary behavior topics in a required course for students in any of grades 6 through 12 during the current school year. a. Benefits of healthy eating 98.4 96.1 100.0 97.5 b. Benefits of drinking plenty of water 96.6 95.4 100.0 96.4 92.3 c. Benefits of eating breakfast every day 88.1 94.8 90.5 94.0 d. Food guidance using the current Dietary Guidelines for Americans (e.g., MyPlate, healthy eating patterns) 90.7 100.0 93.0 95.8 e. Using food labels 91.2 91.0 93.0 0 20 40 60 80 100 High Schools Middle Schools Junior/Senior High Schools All Schools Page 41 of 78
WISCONSIN 2022 School Health Profiles Report Weighted Lead Health Education Teacher Survey Results 15. Percentage of schools in which teachers taught each of the following nutrition and dietary behavior topics in a required course for students in any of grades 6 through 12 during the current school year. f. Differentiating between nutritious and non-nutritious beverages 93.2 89.7 88.4 90.9 g. Balancing food intake and physical activity 93.1 94.0 100.0 94.3 96.7 h. Eating more fruits, vegetables, and whole grain products 94.6 96.5 95.6 94.9 i. Choosing a variety of options within each food group 93.1 93.1 93.8 89.8 j. Choosing nutrient-dense foods and beverages that reflect personal preferences, culture, and budget 84.6 91.0 87.4 0 20 40 60 80 100 High Schools Middle Schools Junior/Senior High Schools All Schools Page 42 of 78
WISCONSIN 2022 School Health Profiles Report Weighted Lead Health Education Teacher Survey Results 15. Percentage of schools in which teachers taught each of the following nutrition and dietary behavior topics in a required course for students in any of grades 6 through 12 during the current school year. k. Choosing foods and snacks that are low in solid fat (i.e., saturated and trans fat) 90.8 85.5 88.4 87.9 l. Choosing foods, snacks, and beverages that are low in added sugars 94.0 91.9 90.5 92.6 89.1 m. Choosing foods and snacks that are low in sodium 84.9 82.0 86.2 84.8 n. Eating a variety of foods that are high in calcium 83.0 82.0 83.6 83.8 o. Eating a variety of foods that are high in iron 76.5 82.0 80.0 0 20 40 60 80 100 High Schools Middle Schools Junior/Senior High Schools All Schools Page 43 of 78
WISCONSIN 2022 School Health Profiles Report Weighted Lead Health Education Teacher Survey Results 15. Percentage of schools in which teachers taught each of the following nutrition and dietary behavior topics in a required course for students in any of grades 6 through 12 during the current school year. p. Food safety 75.4 72.1 87.7 75.1 86.6 q. Preparing healthy meals and snacks 79.2 90.4 83.3 93.1 r. Risks of unhealthy weight control practices 83.3 93.1 88.3 92.4 s. Accepting body size differences 83.3 93.1 88.0 0 20 40 60 80 100 High Schools Middle Schools Junior/Senior High Schools All Schools Page 44 of 78
WISCONSIN 2022 School Health Profiles Report Weighted Lead Health Education Teacher Survey Results 15. Percentage of schools in which teachers taught each of the following nutrition and dietary behavior topics in a required course for students in any of grades 6 through 12 during the current school year. t. Signs, symptoms, and treatment for eating disorders 92.6 74.0 90.4 83.1 90.8 u. Relationship between diet and chronic diseases 78.7 85.4 84.1 90.4 v. Finding valid information about nutrition (e.g., differentiating between advertising and factual information) 85.0 90.9 87.7 70.8 w. Food production, including how food is grown, harvested, processed, packaged, and transported 60.6 83.4 67.2 0 20 40 60 80 100 High Schools Middle Schools Junior/Senior High Schools All Schools Page 45 of 78
WISCONSIN 2022 School Health Profiles Report Weighted Lead Health Education Teacher Survey Results 15N. Percentage of schools that taught all 23 nutrition and dietary behavior topics during the current school year.* 59.9 47.1 65.5 54.1 0 20 40 60 80 100 High Schools Middle Schools Junior/Senior High Schools All Schools *Responses to question 15 a through w all are "yes." Page 46 of 78
WISCONSIN 2022 School Health Profiles Report Weighted Lead Health Education Teacher Survey Results 16. Percentage of schools in which teachers taught each of the following physical activity topics in a required course for students in any of grades 6 through 12 during the current school year. a. Short-term and long-term benefits of physical activity, including reducing the risks for chronic disease 97.5 96.4 94.4 96.6 b. Mental and social benefits of physical activity 98.3 95.6 96.9 96.8 93.2 c. Health-related fitness (i.e., cardiorespiratory endurance, muscular endurance, muscular strength, flexibility, and body composition) 90.9 93.4 92.1 84.0 d. Phases of a workout (i.e., warm-up, workout, and cool down) 83.0 84.5 83.5 86.1 e. Recommended amounts and types of moderate, vigorous, muscle- strengthening, and bone-strengthening physical activity 87.7 85.1 86.8 0 20 40 60 80 100 High Schools Middle Schools Junior/Senior High Schools All Schools Page 47 of 78
WISCONSIN 2022 School Health Profiles Report Weighted Lead Health Education Teacher Survey Results 16. Percentage of schools in which teachers taught each of the following physical activity topics in a required course for students in any of grades 6 through 12 during the current school year. f. Decreasing sedentary activities (e.g., television viewing, using video games) 89.8 93.4 94.2 92.1 g. Preventing injury during physical activity 86.4 84.8 91.1 86.2 76.9 h. Weather-related safety (e.g., avoiding heat stroke, hypothermia, and sunburn while physically active) 71.4 87.5 75.3 88.1 i. Dangers of using performance-enhancing drugs (e.g., steroids) 75.1 76.5 80.4 96.5 j. Increasing daily physical activity 94.8 96.9 95.7 0 20 40 60 80 100 High Schools Middle Schools Junior/Senior High Schools All Schools Page 48 of 78
WISCONSIN 2022 School Health Profiles Report Weighted Lead Health Education Teacher Survey Results 16. Percentage of schools in which teachers taught each of the following physical activity topics in a required course for students in any of grades 6 through 12 during the current school year. 92.9 k. Incorporating physical activity into daily life (without relying on a structured exercise plan or special equipment) 94.2 93.7 93.6 81.4 77.8 l. Using safety equipment for specific physical activities 91.8 80.8 90.5 92.3 m. Benefits of drinking water before, during, and after physical activity 97.0 92.1 0 20 40 60 80 100 High Schools Middle Schools Junior/Senior High Schools All Schools Page 49 of 78
WISCONSIN 2022 School Health Profiles Report Weighted Lead Health Education Teacher Survey Results 16N. Percentage of schools that taught all 13 physical activity topics during the current school year.* 66.9 57.5 71.9 62.7 0 20 40 60 80 100 High Schools Middle Schools Junior/Senior High Schools All Schools *Responses to question 16 a through m all are "yes." Page 50 of 78