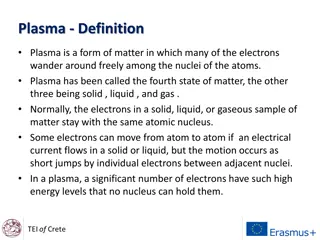
Evolution of Collisionless Plasma Bounded by Absorbing Walls

Study on the evolution of collisionless plasma between absorbing walls, analyzing rarefaction waves, density profiles, and plasma potential decay. Kinetic simulations reveal gas dynamics-like behavior with flat density profiles and linear velocity profiles leading to asymptotic decay. The influence of electron adiabatic behavior, plasma potential dynamics, and the interaction of rarefaction waves are discussed, along with comparisons to ordinary gas dynamics. Motivations for the study and implications for plasma-based technologies are highlighted.

Download Presentation

Please find below an Image/Link to download the presentation.
The content on the website is provided AS IS for your information and personal use only. It may not be sold, licensed, or shared on other websites without obtaining consent from the author. Download presentation by click this link. If you encounter any issues during the download, it is possible that the publisher has removed the file from their server.
E N D
Presentation Transcript
Collisionless Adiabatic Collisionless Adiabatic Afterglow Afterglow A. V. Khrabrov, I. D. Kaganovich, J. Chen, and H. Guo Princeton Plasma Physics Laboratory, Princeton NJ 08543 USA Online Low-Temperature Plasma Seminar March 23, 2021 1
Abstract We study the evolution of a collisionless plasma initiated between absorbing walls. The ensuing flow is defined by rarefaction waves which travel inward from the boundaries, interact, and eventually vanish after crossing through, leading up to the asymptotic stage of the decay. Kinetic simulations indicate that the evolution strongly resembles one found in gas dynamics: a flat density profile spreads out from the central region where the rarefaction waves interact, with an accompanying linear velocity profile. Asymptotically, the density falls off as 1/t. The density and the flux at the boundary show little variation over the period when rarefaction waves still exist. Plasma potential, on the other hand, drops rapidly (on the ion-acoustic time scale) to less than Te when only 30% of the plasma is depleted. This is due to electron kinetics being governed by conservation of adiabatic invariant in a slowly varying potential well. Analytical model of the velocity distribution is presented to explain the simulations. 2
Motivation and Highlights Decay of plasmas bounded by material surfaces is of interest in connection with laser-produced plasmas, pulse-driven discharges in material processing (ion implantation), and plasma-based power switching devices. Semi-infinite plasmas were studied in 1960s; the flow to the wall is in the form of a self-similar rarefaction wave. Plasmas of finite size were mostly studied as a free-expansion problem, to investigate acceleration of ions at the propagating edge. This work originates from examiing 1D PIC simulations of a plasma evolving between absorbing walls. Specifically, the following observations were made and had to explained: The plasma potential drops to low values (below Te) when most (70%) of the plasma is still present. Adiabatic behavior of electrons was identified as the cause. Low-energy portion of the distribution is strongly modified (flattened) by the shrinking ambipolar potential well. Interaction of two rarefaction waves, propagating inward from the boundaries, results in a very flat density profile and a corresponding linear profile of ion velocity. The density and ion velocity at the wall show little variation while rarefaction fronts still exist in the system. Such behavior, unlike that of the plasma potential, is common with ordinary gas dynamics, but wasn t fully expected in this case. Long-term (t >> L/cs0) evolution is of a universal red-shift type, with a flat density profile and a linear velocity profile, both falling off as 1/t at a given location. The plasma potential and the wall flux both fall of as 1/t2. 3
Waterbag electrons: exactly solvable in quasineutral approximation Successive density profiles shown on the left, flux profiles on the right. Rarefaction waves travel inwards, meet at the symmetry plane, and interact to form a flat profile again. In this case, simple analytical solution is well known to exist. The density falls off exactly as 1/t and the flux as 1/t2. 4
Waterbag electrons: ? = 3 gas dynamics Profiles of plasma potentials on the left, time histories of density and potential at the center on the right. Time histories from PIC simulations are compared against the analytical result. 5
Plasma with Maxwellian electrons at t=0 Density profiles on the left, flux profiles on the right. For clarity, only the period over which the rarefaction fronts travel to the center is shown. The wall flux is not exactly constant over this period, but variation is small, and a stationary point is still present like in gas dynamics. 6
Maxwellian case: non-local kinetics revealed The plasma potential falls off to the value of 0.9Teby the time the rarefaction fronts meet at the center. This is a much lower value than in a Debye sheath, and does not depend on the ion mass. This potential is enough to still hold 70% of the initial plasma. Adiabatic behavior is the key. Asymptotic behavior, shown on the right panel, is universal. 7
Analysis: adiabatic electrons in piecewise linear, slowly changing potential well Successive adiabatic orbits are shown for a specific value of the adiabatic invariant. The parameter a is relative distance traveled by the rarefaction front from the boundary towards center of the plasma. The potential has a jump In the wall sheath at the boundary; its value is set to enforce particle conservation. Trapped electrons are reflected by the wall sheath. Note the energy gain for the trapped electron. This gain depends on the value of the adiabatic invariant. It is higher for those electrons deep inside the well. 8
Adiabatic mapping of the velocity distribution The initial Maxwellian is shown by the blue line; the mapped distribution is plotted in orange. The mapping (magenta) is for the instant when rarefaction waves meet at the center. On the right, the velocity distribution obtained from PIC simulation is compared to the analytical result. 9
Summary In a decaying plasma, electron velocity distribution evolves adiabatically in the potential well formed by rarefaction waves. Conservation of adiabatic invariant defines the mapping which gives the velocity distribution (in terms of total energy) in a given state of the system. The case of a flat-top (waterbag) distribution is exactly solvable in elementary terms. Long-term evolution is universal with respect to the initial velocity distribution: the density falls off as 1/t; the potential and the wall flux both fall of as 1/t2. 10
Publication A. V. Khrabrov, I. D. Kaganovich, J. Chen, H. Guo, Phys. Plasmas 27, 123512 (2020) https://doi.org/10.1063/5.0021833 11
Appendix: reference gas-dynamic solutions Rarefaction front trajectories for different values of adiabatic index Evolution of density profile for ? = 3 12
Density evolution for ? = 1,2,3 In gas dynamics, the rarefaction wave is known as a simple-wave self-similar solution. It is present in the region adjacent to the wall until the rarefaction fronts have travelled all the way across. Note the constant density values at the wall. 13
Velocity profiles in gas dynamics The profiles in simple wave-solutions are exactly linear. The profiles in the interaction region are linear with good accuracy. This property is also found in particle-in-cell simulations. 14
Acknowledgment This material is based upon work supported by the U.S. Department of Energy, Office of Science, Office of Fusion Energy Sciences under contract number DE-AC02-09CH11466. 15